- Home >
- Stock Photos >
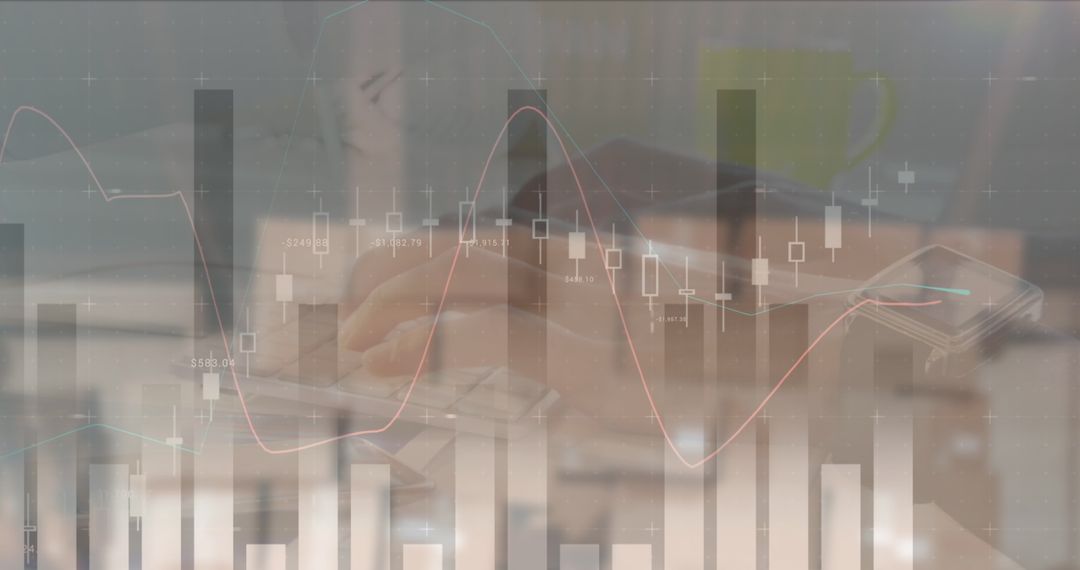
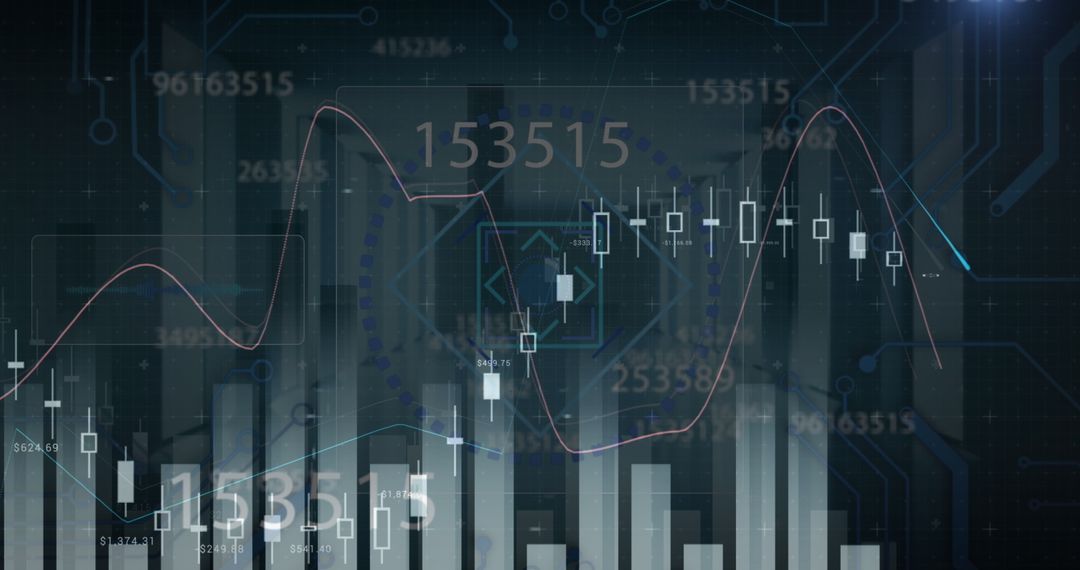
- Digital Finance Visualization with Graphs and Analytics
Digital Finance Visualization with Graphs and Analytics Image

This image depicts charts and graphs overlaid with stock numbers and data, reflecting financial trading and analysis in a business environment. Use in presentations about financial markets, investment strategies, or tech-integrated financial solutions. Suitable for articles on financial tips and technological advancements in finance sector.
Powered by 


2
downloads
downloads
Tags:
More
Credit Photo
If you would like to credit the Photo, here are some ways you can do so
Text Link
photo Link
<span class="text-link">
<span>
<a target="_blank" href=https://pikwizard.com/photo/digital-finance-visualization-with-graphs-and-analytics/591051e3d5138e53f6435ad1d25814ab/>PikWizard</a>
</span>
</span>
<span class="image-link">
<span
style="margin: 0 0 20px 0; display: inline-block; vertical-align: middle; width: 100%;"
>
<a
target="_blank"
href="https://pikwizard.com/photo/digital-finance-visualization-with-graphs-and-analytics/591051e3d5138e53f6435ad1d25814ab/"
style="text-decoration: none; font-size: 10px; margin: 0;"
>
<img src="https://pikwizard.com/pw/medium/591051e3d5138e53f6435ad1d25814ab.jpg" style="margin: 0; width: 100%;" alt="" />
<p style="font-size: 12px; margin: 0;">PikWizard</p>
</a>
</span>
</span>
Free (free of charge)
Free for personal and commercial use.
Author: Awesome Content
Similar Free Stock Images

Premium


Premium


Premium


Premium


Premium


Premium


Premium


Premium


Premium


Premium


Premium


Premium


Premium


Premium


Premium


Premium


Premium


Premium


Premium


Premium


Premium


Premium


Premium


Premium