
- Home >
- Stock Photos >
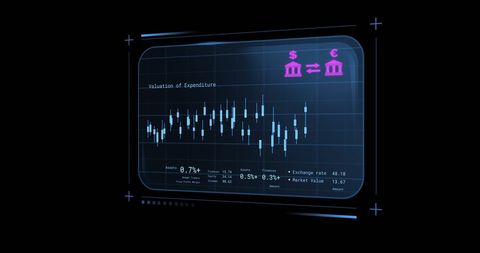
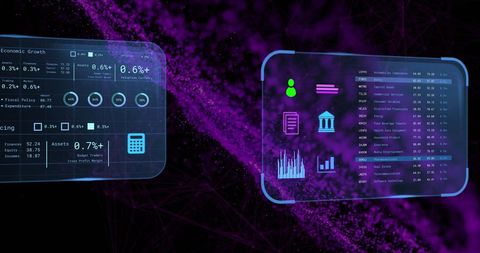
- Digital Financial Analysis Interface on Purple Background
Digital Financial Analysis Interface on Purple Background Image
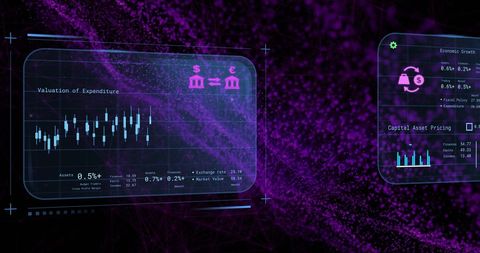
Visualizing digital presentations of financial data over a dynamic purple background creates a futuristic and technological feel. Suitable for use in presentations on economic trends, financial analytics, or showcasing innovative data processing solutions.
Powered by 


downloads
Tags:
More
Credit Photo
If you would like to credit the Photo, here are some ways you can do so
Text Link
photo Link
<span class="text-link">
<span>
<a target="_blank" href=https://pikwizard.com/photo/digital-financial-analysis-interface-on-purple-background/f1cf292c2c309e08e641aa87ef3f01c1/>PikWizard</a>
</span>
</span>
<span class="image-link">
<span
style="margin: 0 0 20px 0; display: inline-block; vertical-align: middle; width: 100%;"
>
<a
target="_blank"
href="https://pikwizard.com/photo/digital-financial-analysis-interface-on-purple-background/f1cf292c2c309e08e641aa87ef3f01c1/"
style="text-decoration: none; font-size: 10px; margin: 0;"
>
<img src="https://pikwizard.com/pw/medium/f1cf292c2c309e08e641aa87ef3f01c1.jpg" style="margin: 0; width: 100%;" alt="" />
<p style="font-size: 12px; margin: 0;">PikWizard</p>
</a>
</span>
</span>
Free (free of charge)
Free for personal and commercial use.
Author: People Creations
Similar Free Stock Images
Premium


Premium

Premium

Premium


Premium


Premium


Premium


Premium


Premium


Premium


Premium


Premium

Premium

Premium


Premium


Premium


Premium

Premium

Premium


Premium


Premium

Premium


Premium


Premium


Premium

Explore More Free Stock Images