
- Home >
- Stock Photos >
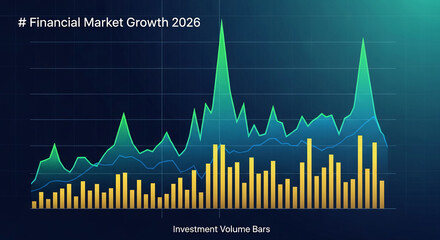
- Digital Financial Analysis Interface Over Data Grid
Digital Financial Analysis Interface Over Data Grid Image

This visualization of a digital financial analysis interface over a data grid represents the integration of technology in finance. Perfect for illustrating concepts related to statistics, global data sharing, and digital information management. Suitable for business presentations, financial reports, or articles on data-driven decision-making.
Powered by 


downloads
Tags:
More
Credit Photo
If you would like to credit the Photo, here are some ways you can do so
Text Link
photo Link
<span class="text-link">
<span>
<a target="_blank" href=https://pikwizard.com/photo/digital-financial-analysis-interface-over-data-grid/8880ae54bb06e781c8c64f29c0e73714/>PikWizard</a>
</span>
</span>
<span class="image-link">
<span
style="margin: 0 0 20px 0; display: inline-block; vertical-align: middle; width: 100%;"
>
<a
target="_blank"
href="https://pikwizard.com/photo/digital-financial-analysis-interface-over-data-grid/8880ae54bb06e781c8c64f29c0e73714/"
style="text-decoration: none; font-size: 10px; margin: 0;"
>
<img src="https://pikwizard.com/pw/medium/8880ae54bb06e781c8c64f29c0e73714.jpg" style="margin: 0; width: 100%;" alt="" />
<p style="font-size: 12px; margin: 0;">PikWizard</p>
</a>
</span>
</span>
Free (free of charge)
Free for personal and commercial use.
Author: People Creations
Similar Free Stock Images

Premium


Premium
Premium


Premium


Premium

Premium

Premium


Premium


Premium


Premium


Premium

Premium

Premium


Premium


Premium


Premium


Premium

Premium


Premium


Premium


Premium


Premium


Premium


Premium


Premium

Explore More Free Stock Images