
- Home >
- Stock Photos >
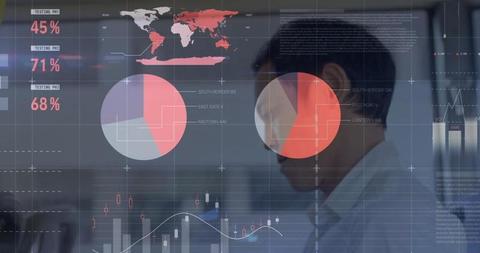
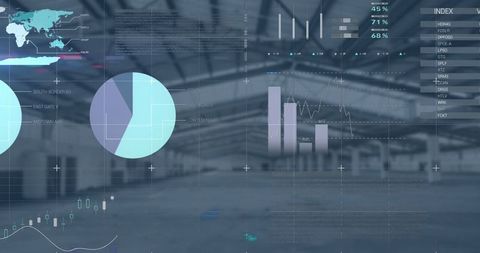
- Digital Financial Analysis Over Warehouse Activities
Digital Financial Analysis Over Warehouse Activities Image

This visual seamlessly combines themes of financial data analysis with warehouse operations. Ideal for representing concepts in logistics, supply chain management, and business strategy. Useful for illustrating technology’s role in modern commerce, coupled with analytical processes and economic forecasting.
Powered by  - Get 15% off with code: PIKWIZARD15


2
downloads
downloads
Tags:
More
Credit Photo
If you would like to credit the Photo, here are some ways you can do so
Text Link
photo Link
<span class="text-link">
<span>
<a target="_blank" href=https://pikwizard.com/photo/digital-financial-analysis-over-warehouse-activities/38b6a7e5aea10d5903872e194edb0f14/>PikWizard</a>
</span>
</span>
<span class="image-link">
<span
style="margin: 0 0 20px 0; display: inline-block; vertical-align: middle; width: 100%;"
>
<a
target="_blank"
href="https://pikwizard.com/photo/digital-financial-analysis-over-warehouse-activities/38b6a7e5aea10d5903872e194edb0f14/"
style="text-decoration: none; font-size: 10px; margin: 0;"
>
<img src="https://pikwizard.com/pw/medium/38b6a7e5aea10d5903872e194edb0f14.jpg" style="margin: 0; width: 100%;" alt="" />
<p style="font-size: 12px; margin: 0;">PikWizard</p>
</a>
</span>
</span>
Free (free of charge)
Free for personal and commercial use.
Author: People Creations
Similar Free Stock Images
Loading...

Premium


Premium


Premium


Premium

Premium


Premium
Premium


Premium

Premium


Premium

Premium


Premium


Premium


Premium


Premium


Premium


Premium


Premium


Premium

Premium


Premium


Premium
Premium


Premium
Premium
