
- Home >
- Stock Photos >
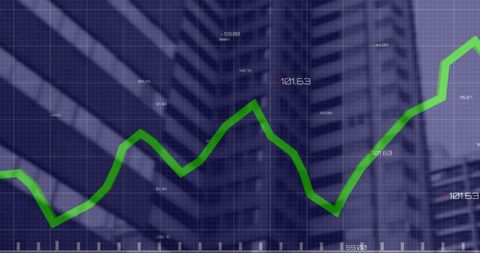
- Digital Financial Analysis with 3D Graphs
Digital Financial Analysis with 3D Graphs Image

Three-dimensional green bar charts and dynamic line graphs illustrate market trends on digital trading gridlines. Figures with subtle highlights provide detailed financial analytics. Useful for articles and presentations focused on economic performance, data analysis industries, technology-driven investment strategies, and case studies on market development via innovative graphing.
Powered by 


downloads
Tags:
More
Credit Photo
If you would like to credit the Photo, here are some ways you can do so
Text Link
photo Link
<span class="text-link">
<span>
<a target="_blank" href=https://pikwizard.com/photo/digital-financial-analysis-with-3d-graphs/00a779c8be20061b5574e48304e82dfc/>PikWizard</a>
</span>
</span>
<span class="image-link">
<span
style="margin: 0 0 20px 0; display: inline-block; vertical-align: middle; width: 100%;"
>
<a
target="_blank"
href="https://pikwizard.com/photo/digital-financial-analysis-with-3d-graphs/00a779c8be20061b5574e48304e82dfc/"
style="text-decoration: none; font-size: 10px; margin: 0;"
>
<img src="https://pikwizard.com/pw/medium/00a779c8be20061b5574e48304e82dfc.jpg" style="margin: 0; width: 100%;" alt="" />
<p style="font-size: 12px; margin: 0;">PikWizard</p>
</a>
</span>
</span>
Free (free of charge)
Free for personal and commercial use.
Author: People Creations
Similar Free Stock Images

Premium


Premium

Premium


Premium

Premium


Premium


Premium


Premium

Premium

Premium


Premium


Premium

Premium


Premium

Premium
Premium


Premium


Premium


Premium

Premium


Premium


Premium


Premium


Premium


Premium

Explore More Free Stock Images