- Home >
- Stock Photos >
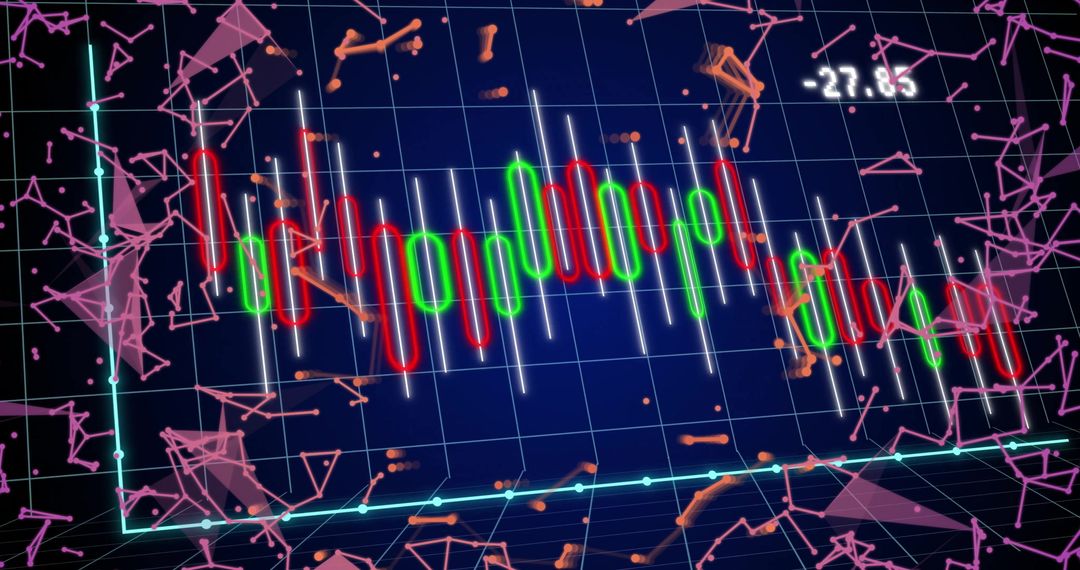
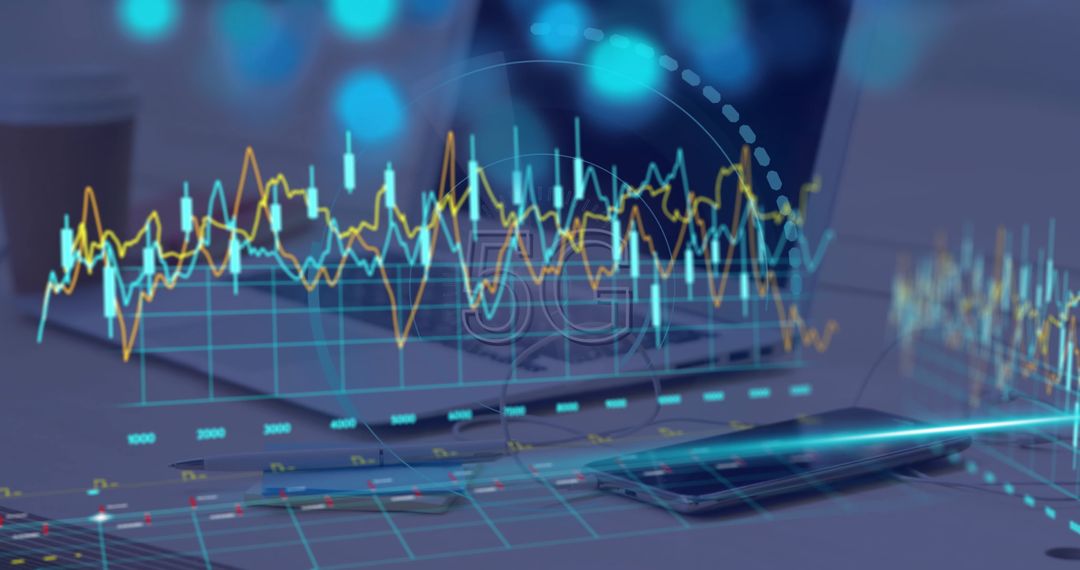
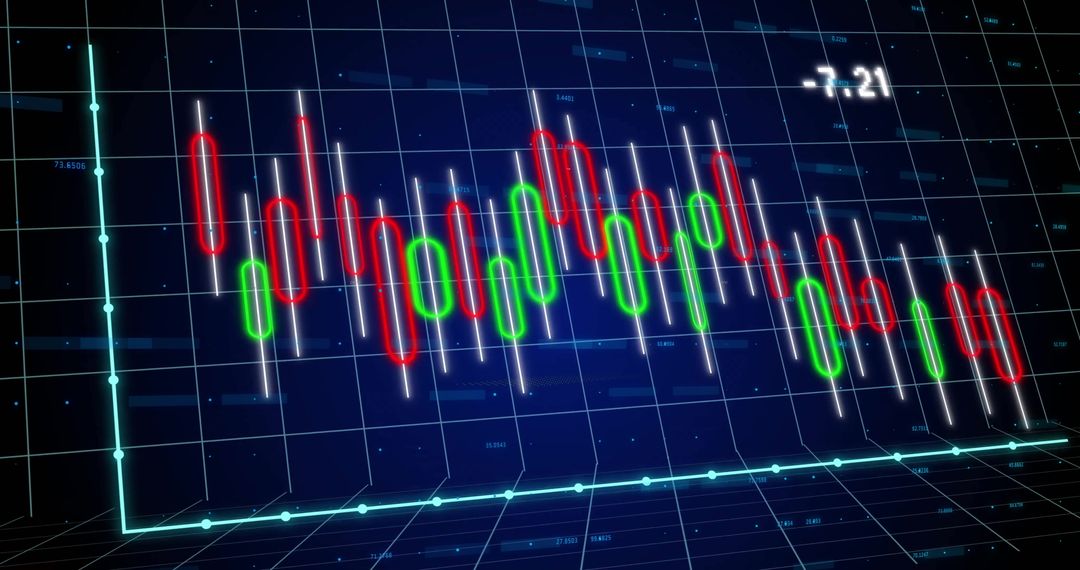
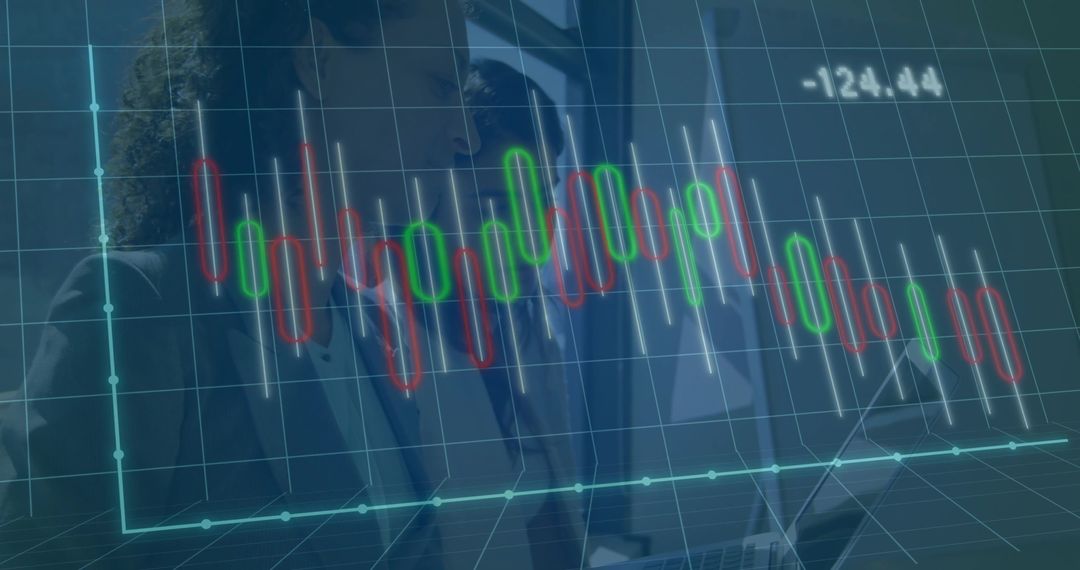
- Digital Financial Analysis with Candlestick Chart on Office Desk
Digital Financial Analysis with Candlestick Chart on Office Desk Image
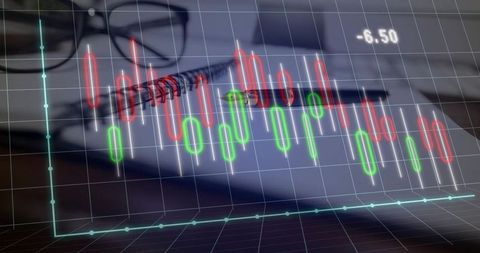
View of candlestick chart overlayed on office desk with reading glasses and pen, suggesting financial analysis activity. Used typically in settings related to finance, trading, or investing. Ideal for illustrating market trends, investment strategies, financial reports, and digital business tools.
Powered by  - Get 15% off with code: PIKWIZARD15


0
downloads
downloads
Tags:
More
Credit Photo
If you would like to credit the Photo, here are some ways you can do so
Text Link
photo Link
<span class="text-link">
<span>
<a target="_blank" href=https://pikwizard.com/photo/digital-financial-analysis-with-candlestick-chart-on-office-desk/00b8290a41d9adcd902532cafa2e694e/>PikWizard</a>
</span>
</span>
<span class="image-link">
<span
style="margin: 0 0 20px 0; display: inline-block; vertical-align: middle; width: 100%;"
>
<a
target="_blank"
href="https://pikwizard.com/photo/digital-financial-analysis-with-candlestick-chart-on-office-desk/00b8290a41d9adcd902532cafa2e694e/"
style="text-decoration: none; font-size: 10px; margin: 0;"
>
<img src="https://pikwizard.com/pw/medium/00b8290a41d9adcd902532cafa2e694e.jpg" style="margin: 0; width: 100%;" alt="" />
<p style="font-size: 12px; margin: 0;">PikWizard</p>
</a>
</span>
</span>
Free (free of charge)
Free for personal and commercial use.
Author: Creative Art
Similar Free Stock Images
Premium


Premium


Premium


Premium


Premium


Premium


Premium


Premium


Premium


Premium


Premium


Premium


Premium


Premium


Premium


Premium


Premium


Premium


Premium


Premium


Premium


Premium


Premium


Premium