
- Home >
- Stock Photos >
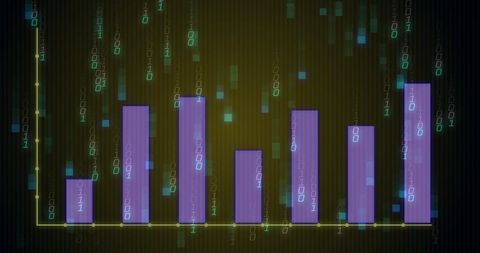
- Digital Financial Analysis with Charts and Binary Code Overlay
Digital Financial Analysis with Charts and Binary Code Overlay Image
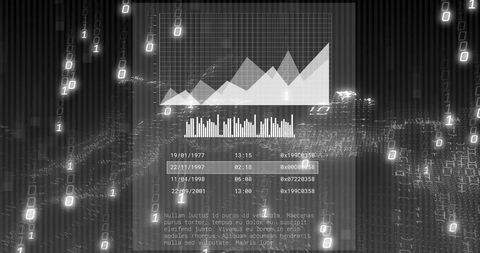
Featuring a digital interface with financial data in graph form alongside barcodes and binary code. Designed for uses in depicting finance analysis and modern technology in business presentations, articles, or financial advisories.
Powered by 


downloads
Credit Photo
If you would like to credit the Photo, here are some ways you can do so
Text Link
photo Link
<span class="text-link">
<span>
<a target="_blank" href=https://pikwizard.com/photo/digital-financial-analysis-with-charts-and-binary-code-overlay/d0ec6b1d8dfa66f3f0119b4d8d1b180a/>PikWizard</a>
</span>
</span>
<span class="image-link">
<span
style="margin: 0 0 20px 0; display: inline-block; vertical-align: middle; width: 100%;"
>
<a
target="_blank"
href="https://pikwizard.com/photo/digital-financial-analysis-with-charts-and-binary-code-overlay/d0ec6b1d8dfa66f3f0119b4d8d1b180a/"
style="text-decoration: none; font-size: 10px; margin: 0;"
>
<img src="https://pikwizard.com/pw/medium/d0ec6b1d8dfa66f3f0119b4d8d1b180a.jpg" style="margin: 0; width: 100%;" alt="" />
<p style="font-size: 12px; margin: 0;">PikWizard</p>
</a>
</span>
</span>
Free (free of charge)
Free for personal and commercial use.
Author: Creative Art
Similar Free Stock Images

Premium


Premium

Premium


Premium


Premium


Premium

Premium

Premium


Premium

Premium


Premium

AI


Premium


Premium


Premium


Premium


Premium

Premium

Premium


Premium


Premium


AI


Premium


Premium


Premium


Premium

Premium


Explore More Free Stock Images