
- Home >
- Stock Photos >
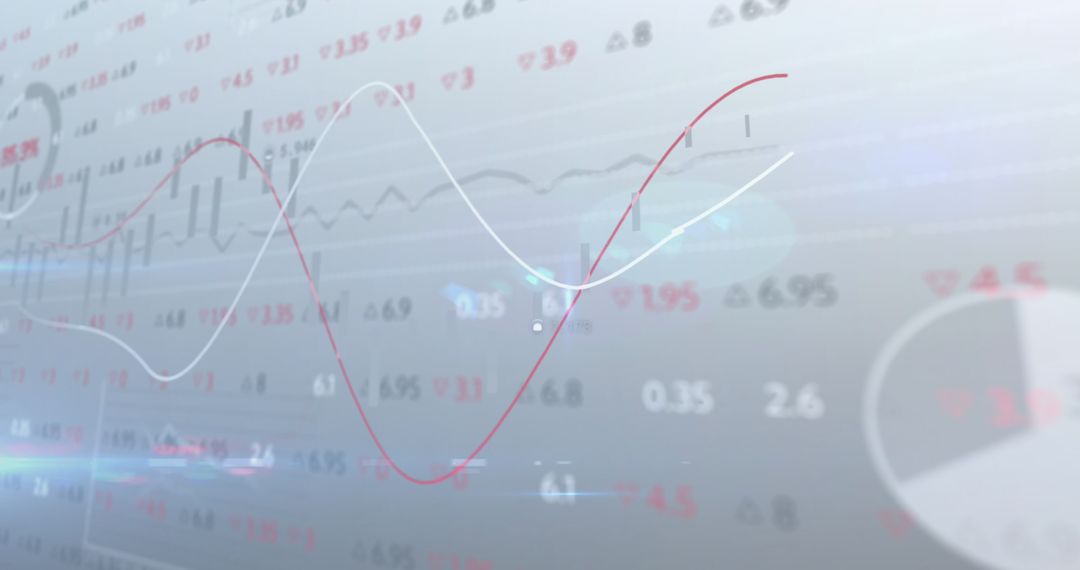
- Digital Financial Analysis with Soaring Graphs and Statistics
Digital Financial Analysis with Soaring Graphs and Statistics Image

This image presents a dynamic digital graphical representation of financial data with line graphs trending upward alongside statistical numbers. Ideal for use in content related to financial markets, investing strategies, data-driven decision-making, or economic forecasting, highlighting the complex and fluctuating nature of modern markets through visually engaging charts and interface design.
Powered by  - Get 15% off with code: PIKWIZARD15


2
downloads
downloads
Tags:
More
Credit Photo
If you would like to credit the Photo, here are some ways you can do so
Text Link
photo Link
<span class="text-link">
<span>
<a target="_blank" href=https://pikwizard.com/photo/digital-financial-analysis-with-soaring-graphs-and-statistics/c135da0e7db44aba10287ddf920726f0/>PikWizard</a>
</span>
</span>
<span class="image-link">
<span
style="margin: 0 0 20px 0; display: inline-block; vertical-align: middle; width: 100%;"
>
<a
target="_blank"
href="https://pikwizard.com/photo/digital-financial-analysis-with-soaring-graphs-and-statistics/c135da0e7db44aba10287ddf920726f0/"
style="text-decoration: none; font-size: 10px; margin: 0;"
>
<img src="https://pikwizard.com/pw/medium/c135da0e7db44aba10287ddf920726f0.jpg" style="margin: 0; width: 100%;" alt="" />
<p style="font-size: 12px; margin: 0;">PikWizard</p>
</a>
</span>
</span>
Free (free of charge)
Free for personal and commercial use.
Author: Awesome Content
Similar Free Stock Images

Premium


Premium


Premium


Premium


Premium


Premium


Premium


Premium


Premium


Premium


Premium


Premium


Premium


Premium


Premium


Premium


Premium


Premium


Premium


Premium


Premium


Premium


Premium


Premium

