
- Home >
- Stock Photos >
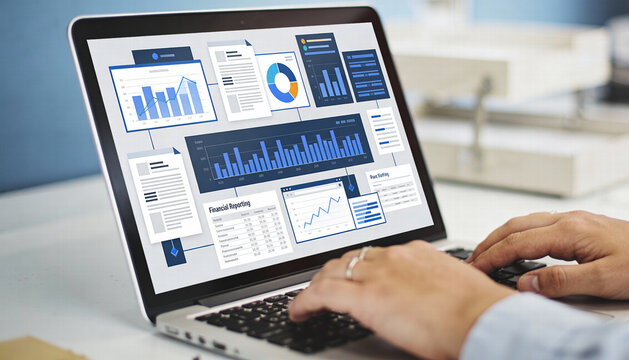
- Digital Financial Analysis with Tablets and Data Visualizations
Digital Financial Analysis with Tablets and Data Visualizations Image

Image depicts a digital approach to financial analysis, with hands interacting with tablet showcasing complex data visualizations, charts, and statistics. Useful for illustrating modern financial services, fintech technologies, and global business strategies. Suitable for content on digital transformation in finance and innovative financial monitoring tools.
Powered by 


downloads
Tags:
More
Credit Photo
If you would like to credit the Photo, here are some ways you can do so
Text Link
photo Link
<span class="text-link">
<span>
<a target="_blank" href=https://pikwizard.com/photo/digital-financial-analysis-with-tablets-and-data-visualizations/3f95478a88053ff343c62ac2ae7c86d2/>PikWizard</a>
</span>
</span>
<span class="image-link">
<span
style="margin: 0 0 20px 0; display: inline-block; vertical-align: middle; width: 100%;"
>
<a
target="_blank"
href="https://pikwizard.com/photo/digital-financial-analysis-with-tablets-and-data-visualizations/3f95478a88053ff343c62ac2ae7c86d2/"
style="text-decoration: none; font-size: 10px; margin: 0;"
>
<img src="https://pikwizard.com/pw/medium/3f95478a88053ff343c62ac2ae7c86d2.jpg" style="margin: 0; width: 100%;" alt="" />
<p style="font-size: 12px; margin: 0;">PikWizard</p>
</a>
</span>
</span>
Free (free of charge)
Free for personal and commercial use.
Author: Creative Art
Similar Free Stock Images

Premium


Premium


Premium


Premium


Premium


Premium


Premium


Premium


Premium


Premium


Premium


Premium


Premium


Premium


Premium


Premium


Premium


Premium


Premium


Premium


Premium


Premium


Premium


Premium


Premium


Explore More Free Stock Images