
- Home >
- Stock Photos >
- Digital Financial Analytics and Currency Visualization Interface
Digital Financial Analytics and Currency Visualization Interface Image
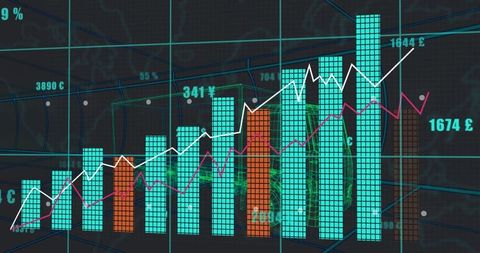
Illustration visualizing futuristic interface with teal and orange bar charts, highlighting diverse currency metrics. White and magenta lines enhance detail on economic trends. Ideal for showcasing technology in financial analysis, adding modern touch to websites or educational materials about economic trends, stock markets, and investment strategies.

downloads
Tags:
More
Credit Photo
If you would like to credit the Photo, here are some ways you can do so
Text Link
photo Link
<span class="text-link">
<span>
<a target="_blank" href=https://pikwizard.com/photo/digital-financial-analytics-and-currency-visualization-interface/7bc8c8a1f7147f9e2a543939b9eae661/>PikWizard</a>
</span>
</span>
<span class="image-link">
<span
style="margin: 0 0 20px 0; display: inline-block; vertical-align: middle; width: 100%;"
>
<a
target="_blank"
href="https://pikwizard.com/photo/digital-financial-analytics-and-currency-visualization-interface/7bc8c8a1f7147f9e2a543939b9eae661/"
style="text-decoration: none; font-size: 10px; margin: 0;"
>
<img src="https://pikwizard.com/pw/medium/7bc8c8a1f7147f9e2a543939b9eae661.jpg" style="margin: 0; width: 100%;" alt="" />
<p style="font-size: 12px; margin: 0;">PikWizard</p>
</a>
</span>
</span>
Free (free of charge)
Free for personal and commercial use.
Author: Awesome Content