- Home >
- Stock Photos >
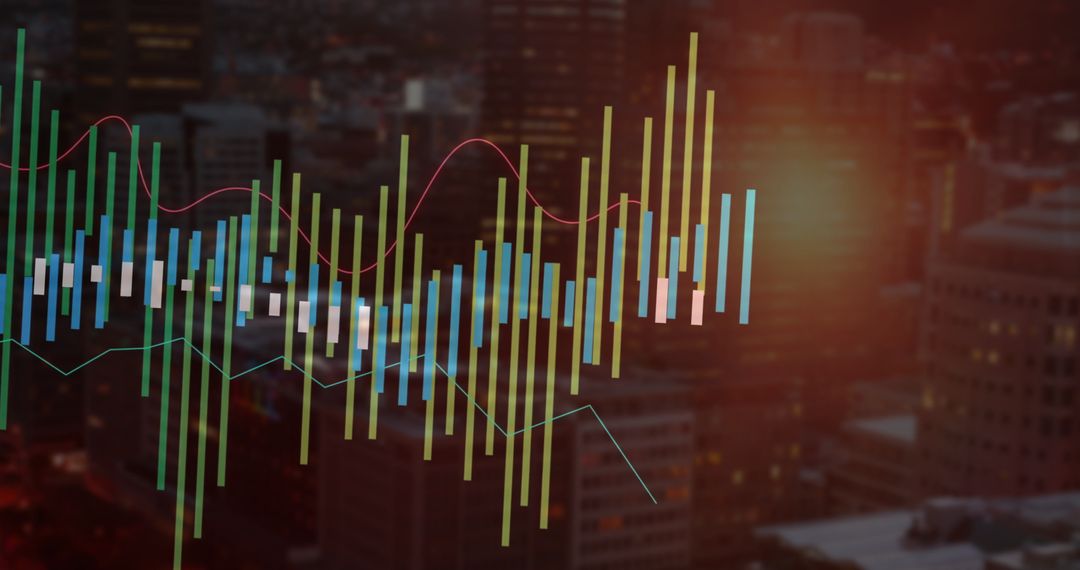
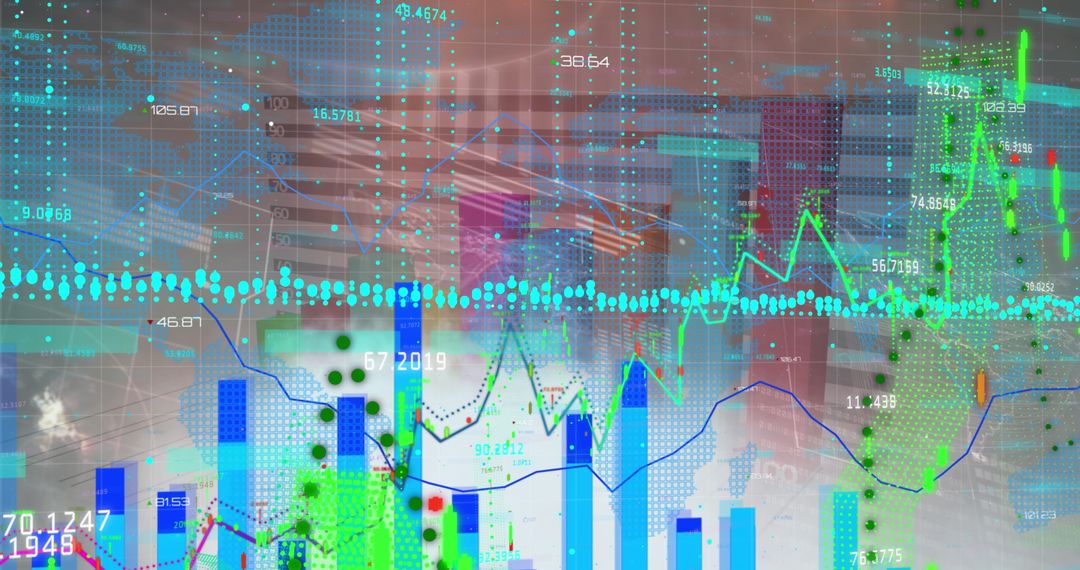
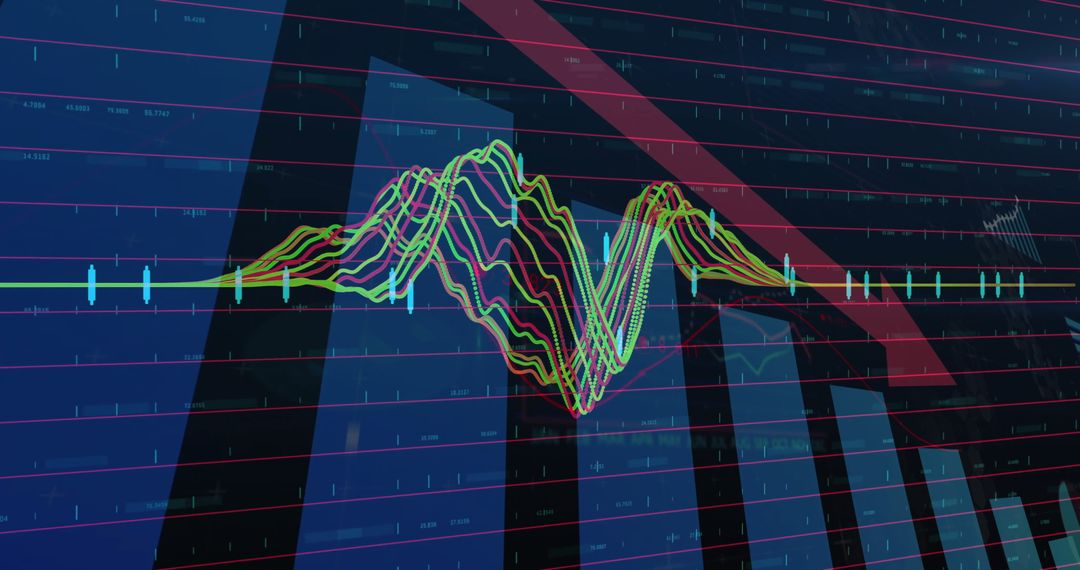
- Digital Financial Analytics Display and Luminous Cityscape
Digital Financial Analytics Display and Luminous Cityscape Image

Image demonstrates a blend of digital financial analytics interfacing with futuristic city lights. Ideal for illustrating themes of business analytics, modern data trends, urban development, financial technology, or presentations related to stock trading and economic analysis. Can be used for marketing materials, business reports, or technology features.
Powered by 


0
downloads
downloads
Tags:
More
Credit Photo
If you would like to credit the Photo, here are some ways you can do so
Text Link
photo Link
<span class="text-link">
<span>
<a target="_blank" href=https://pikwizard.com/photo/digital-financial-analytics-display-and-luminous-cityscape/e45e1bcec0e14525477803faa17e0da7/>PikWizard</a>
</span>
</span>
<span class="image-link">
<span
style="margin: 0 0 20px 0; display: inline-block; vertical-align: middle; width: 100%;"
>
<a
target="_blank"
href="https://pikwizard.com/photo/digital-financial-analytics-display-and-luminous-cityscape/e45e1bcec0e14525477803faa17e0da7/"
style="text-decoration: none; font-size: 10px; margin: 0;"
>
<img src="https://pikwizard.com/pw/medium/e45e1bcec0e14525477803faa17e0da7.jpg" style="margin: 0; width: 100%;" alt="" />
<p style="font-size: 12px; margin: 0;">PikWizard</p>
</a>
</span>
</span>
Free (free of charge)
Free for personal and commercial use.
Author: People Creations
Similar Free Stock Images

Premium


Premium


Premium


Premium


Premium


Premium


Premium


Premium


Premium


Premium


Premium


Premium


Premium


Premium


Premium


Premium


Premium


Premium


Premium


Premium


Premium


Premium


Premium


Premium