- Home >
- Stock Photos >
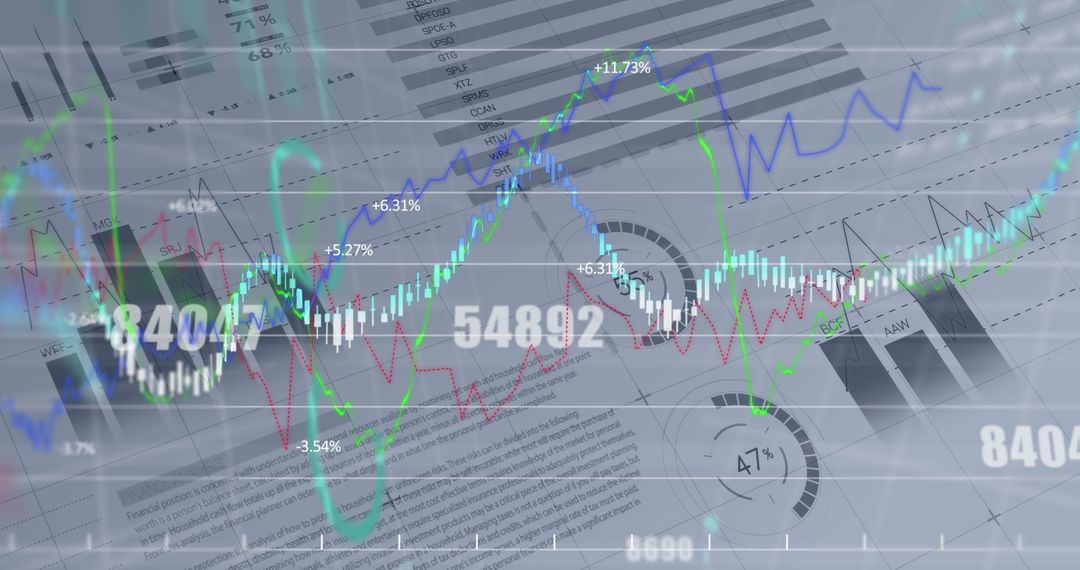
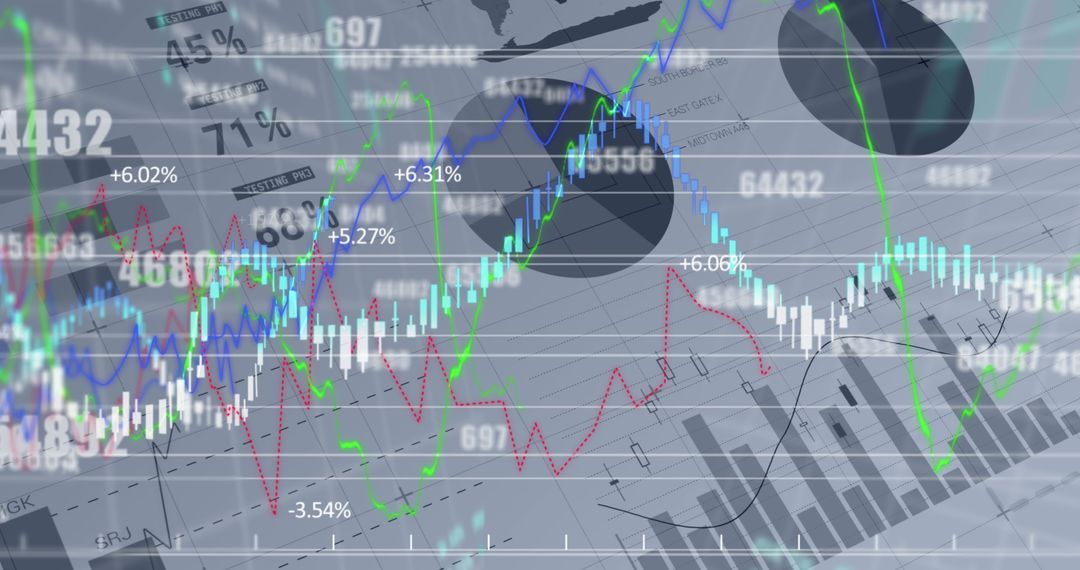
- Digital Financial Analytics Displayed on Abstract Background
Digital Financial Analytics Displayed on Abstract Background Image

Visual representation of financial data and growth patterns displayed over a corporate grey background. Suitable for illustrating concepts related to global economics, stock market analytics, and technology in financial analysis. Can be used on finance, business, or tech blogs, as well as presentations or marketing materials related to investment and economic trends.
Powered by 


2
downloads
downloads
Tags:
More
Credit Photo
If you would like to credit the Photo, here are some ways you can do so
Text Link
photo Link
<span class="text-link">
<span>
<a target="_blank" href=https://pikwizard.com/photo/digital-financial-analytics-displayed-on-abstract-background/2d80ace0d8188342241f33ac23071eaa/>PikWizard</a>
</span>
</span>
<span class="image-link">
<span
style="margin: 0 0 20px 0; display: inline-block; vertical-align: middle; width: 100%;"
>
<a
target="_blank"
href="https://pikwizard.com/photo/digital-financial-analytics-displayed-on-abstract-background/2d80ace0d8188342241f33ac23071eaa/"
style="text-decoration: none; font-size: 10px; margin: 0;"
>
<img src="https://pikwizard.com/pw/medium/2d80ace0d8188342241f33ac23071eaa.jpg" style="margin: 0; width: 100%;" alt="" />
<p style="font-size: 12px; margin: 0;">PikWizard</p>
</a>
</span>
</span>
Free (free of charge)
Free for personal and commercial use.
Author: People Creations
Similar Free Stock Images

Premium


Premium


Premium


Premium


Premium


Premium


Premium


Premium


Premium


Premium


Premium


Premium


Premium


Premium


Premium


Premium


Premium


Premium


Premium


Premium


Premium


Premium


Premium


Premium