- Home >
- Stock Photos >
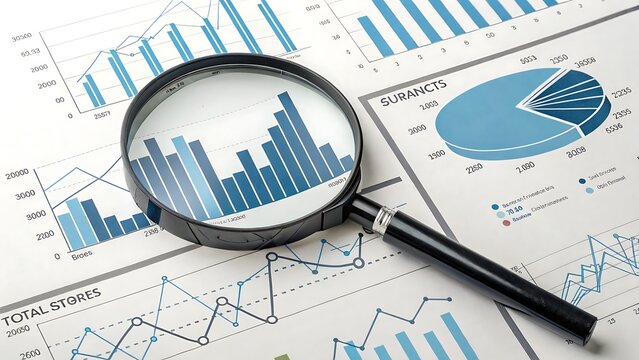
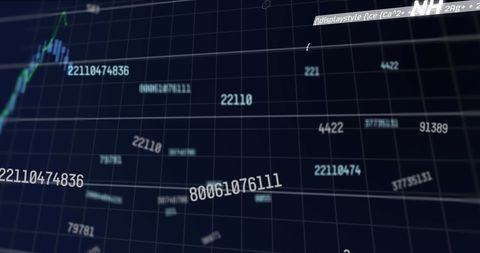
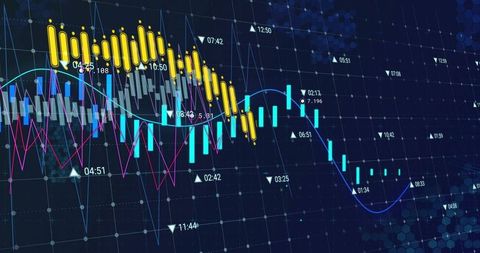
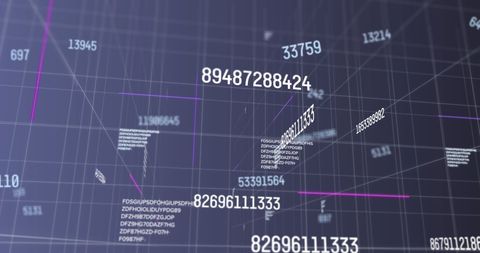
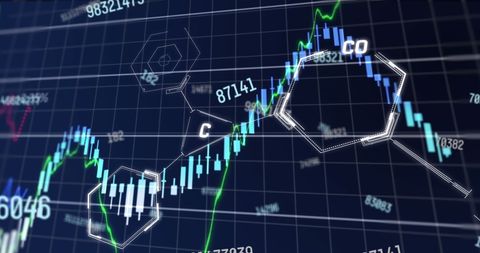
- Digital Financial Analytics Merging with Chemical Data
Digital Financial Analytics Merging with Chemical Data Image

Abstract representation of the convergence between financial data analytics and chemical information. Numbers and patterns overlay on graph structures, symbolizing advanced computational integration. Ideal for illustrating topics in economic engineering, business innovations, tech-driven investments, or multi-disciplinary research.
Powered by 


downloads
Tags:
More
Credit Photo
If you would like to credit the Photo, here are some ways you can do so
Text Link
photo Link
<span class="text-link">
<span>
<a target="_blank" href=https://pikwizard.com/photo/digital-financial-analytics-merging-with-chemical-data/529858b7235176ce6746bc0a4da109c7/>PikWizard</a>
</span>
</span>
<span class="image-link">
<span
style="margin: 0 0 20px 0; display: inline-block; vertical-align: middle; width: 100%;"
>
<a
target="_blank"
href="https://pikwizard.com/photo/digital-financial-analytics-merging-with-chemical-data/529858b7235176ce6746bc0a4da109c7/"
style="text-decoration: none; font-size: 10px; margin: 0;"
>
<img src="https://pikwizard.com/pw/medium/529858b7235176ce6746bc0a4da109c7.jpg" style="margin: 0; width: 100%;" alt="" />
<p style="font-size: 12px; margin: 0;">PikWizard</p>
</a>
</span>
</span>
Free (free of charge)
Free for personal and commercial use.
Author: People Creations
Similar Free Stock Images
Loading...

Premium


Premium


Premium


Premium

Premium


Premium


Premium


Premium


Premium


Premium


Premium


Premium

Premium

Premium


Premium

Premium

Premium


Premium


Premium


Premium

Premium


Premium


Premium

Premium


Premium