- Home >
- Stock Photos >
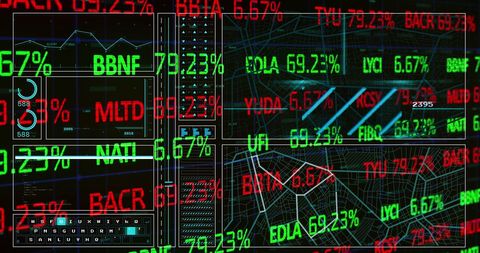
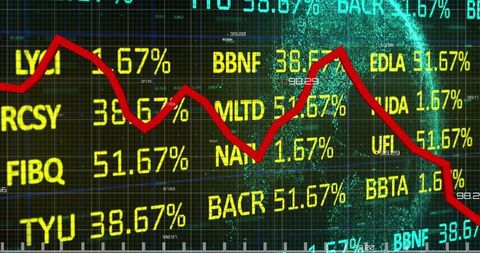
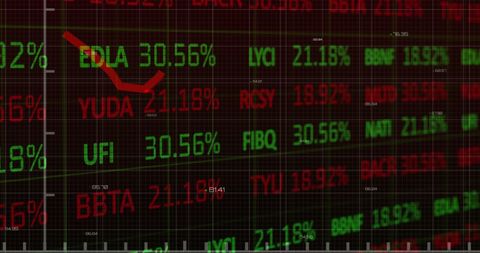
- Digital Financial Analytics Overlayed On Complex Charts
Digital Financial Analytics Overlayed On Complex Charts Image

Features digital overlay of financial data and stock market charts with fluctuating red arrow. Useful for conveying concepts of investment, financial analysis, and economic study. Ideal for websites or presentations on business technology and market trends.

downloads
Tags:
More
Credit Photo
If you would like to credit the Photo, here are some ways you can do so
Text Link
photo Link
<span class="text-link">
<span>
<a target="_blank" href=https://pikwizard.com/photo/digital-financial-analytics-overlayed-on-complex-charts/db02cbc1479f7d71689861191cf34729/>PikWizard</a>
</span>
</span>
<span class="image-link">
<span
style="margin: 0 0 20px 0; display: inline-block; vertical-align: middle; width: 100%;"
>
<a
target="_blank"
href="https://pikwizard.com/photo/digital-financial-analytics-overlayed-on-complex-charts/db02cbc1479f7d71689861191cf34729/"
style="text-decoration: none; font-size: 10px; margin: 0;"
>
<img src="https://pikwizard.com/pw/medium/db02cbc1479f7d71689861191cf34729.jpg" style="margin: 0; width: 100%;" alt="" />
<p style="font-size: 12px; margin: 0;">PikWizard</p>
</a>
</span>
</span>
Free (free of charge)
Free for personal and commercial use.
Author: Authentic Images