
- Home >
- Stock Photos >
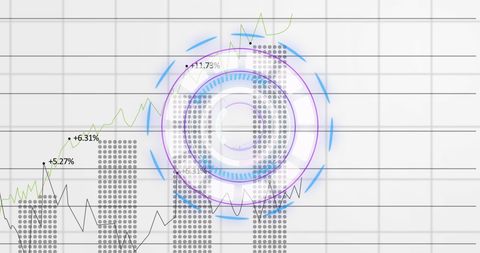
- Digital Financial Analytics with Abstract Data Visualization
Digital Financial Analytics with Abstract Data Visualization Image

Abstract depiction of financial analytics with circular graphics and grid in background conveys innovative technology in financial forecasting and crypto sectors. Useful for presentations on digital finance, cryptocurrency analysis, and market trend prediction.
Powered by  - Get 15% off with code: PIKWIZARD15


downloads
Tags:
More
Credit Photo
If you would like to credit the Photo, here are some ways you can do so
Text Link
photo Link
<span class="text-link">
<span>
<a target="_blank" href=https://pikwizard.com/photo/digital-financial-analytics-with-abstract-data-visualization/021f7633a590362c3870943176436a40/>PikWizard</a>
</span>
</span>
<span class="image-link">
<span
style="margin: 0 0 20px 0; display: inline-block; vertical-align: middle; width: 100%;"
>
<a
target="_blank"
href="https://pikwizard.com/photo/digital-financial-analytics-with-abstract-data-visualization/021f7633a590362c3870943176436a40/"
style="text-decoration: none; font-size: 10px; margin: 0;"
>
<img src="https://pikwizard.com/pw/medium/021f7633a590362c3870943176436a40.jpg" style="margin: 0; width: 100%;" alt="" />
<p style="font-size: 12px; margin: 0;">PikWizard</p>
</a>
</span>
</span>
Free (free of charge)
Free for personal and commercial use.
Author: Creative Art
Similar Free Stock Images

Premium


Premium


Premium


Premium


Premium


Premium


Premium


Premium

Premium


Premium


Premium


Premium


Premium

Premium


Premium


Premium


Premium


Premium


Premium


Premium

Premium


Premium


Premium


Premium

Premium


Explore More Free Stock Images