- Home >
- Stock Photos >
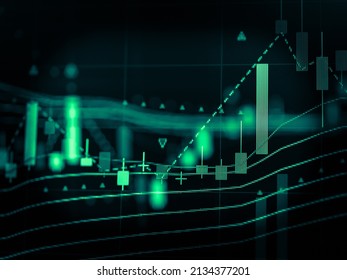
- Digital Financial Analytics with Candlestick Chart and Trend Line
Digital Financial Analytics with Candlestick Chart and Trend Line Image

Featuring a financial trading dashboard, this visualization displays green candlestick bars and a white polyline, highlighting market trends and data analysis. Perfect for articles on investment strategies, economic studies, or presentations on financial technologies, this image captures modern digital information environments within financial sectors. Ideal for use by financial analysts, tech developers, and market researchers in slideshows and promotional content.
Powered by  - Get 15% off with code: PIKWIZARD15


0
downloads
downloads
Tags:
More
Credit Photo
If you would like to credit the Photo, here are some ways you can do so
Text Link
photo Link
<span class="text-link">
<span>
<a target="_blank" href=https://pikwizard.com/photo/digital-financial-analytics-with-candlestick-chart-and-trend-line/e19517c545647b6698154315a07d90f2/>PikWizard</a>
</span>
</span>
<span class="image-link">
<span
style="margin: 0 0 20px 0; display: inline-block; vertical-align: middle; width: 100%;"
>
<a
target="_blank"
href="https://pikwizard.com/photo/digital-financial-analytics-with-candlestick-chart-and-trend-line/e19517c545647b6698154315a07d90f2/"
style="text-decoration: none; font-size: 10px; margin: 0;"
>
<img src="https://pikwizard.com/pw/medium/e19517c545647b6698154315a07d90f2.jpg" style="margin: 0; width: 100%;" alt="" />
<p style="font-size: 12px; margin: 0;">PikWizard</p>
</a>
</span>
</span>
Free (free of charge)
Free for personal and commercial use.
Author: Authentic Images
Similar Free Stock Images
Loading...

Premium


Premium


Premium


Premium

Premium


Premium

Premium

Premium

Premium


Premium

Premium


Premium


Premium


Premium


Premium


Premium


Premium


Premium

Premium


Premium


Premium

Premium


Premium

Premium


Premium