
- Home >
- Stock Photos >
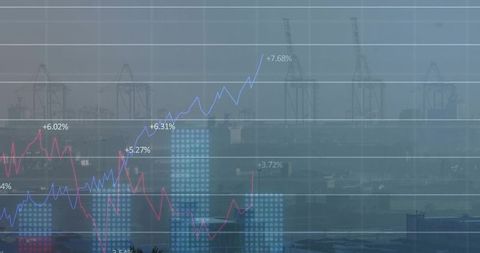
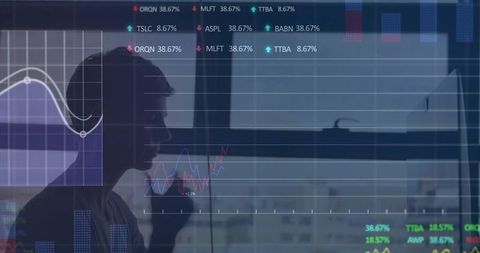
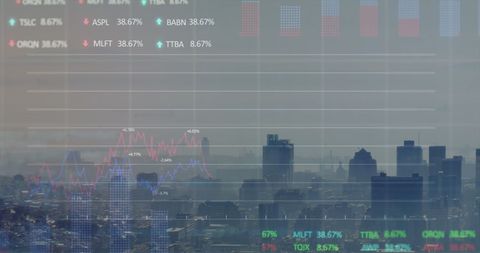
- Digital Financial Analytics with Dynamic Graphs and Code Interface
Digital Financial Analytics with Dynamic Graphs and Code Interface Image

This image showcases the convergence of financial analytics and technology. Featuring red and blue financial graphs with dynamic scrolling beside code snippets and grid lines, it provides an innovative look at data processing interfaces. Ideal for articles or presentations on financial technology, data analysis, and economic trends, illustrating modern approaches to data-driven decision-making in finance.
Powered by  - Get 15% off with code: PIKWIZARD15


downloads
Tags:
More
Credit Photo
If you would like to credit the Photo, here are some ways you can do so
Text Link
photo Link
<span class="text-link">
<span>
<a target="_blank" href=https://pikwizard.com/photo/digital-financial-analytics-with-dynamic-graphs-and-code-interface/2aab1675f75f1aeb5e1d14d6edced1e1/>PikWizard</a>
</span>
</span>
<span class="image-link">
<span
style="margin: 0 0 20px 0; display: inline-block; vertical-align: middle; width: 100%;"
>
<a
target="_blank"
href="https://pikwizard.com/photo/digital-financial-analytics-with-dynamic-graphs-and-code-interface/2aab1675f75f1aeb5e1d14d6edced1e1/"
style="text-decoration: none; font-size: 10px; margin: 0;"
>
<img src="https://pikwizard.com/pw/medium/2aab1675f75f1aeb5e1d14d6edced1e1.jpg" style="margin: 0; width: 100%;" alt="" />
<p style="font-size: 12px; margin: 0;">PikWizard</p>
</a>
</span>
</span>
Free (free of charge)
Free for personal and commercial use.
Author: People Creations
Similar Free Stock Images
Premium


Premium


Premium


Premium


Premium


Premium


Premium


Premium


Premium

Premium


Premium

Premium


Premium


Premium


Premium


Premium


Premium


Premium


Premium


Premium


Premium


Premium

Premium


Premium


Premium


Explore More Free Stock Images