- Home >
- Stock Photos >
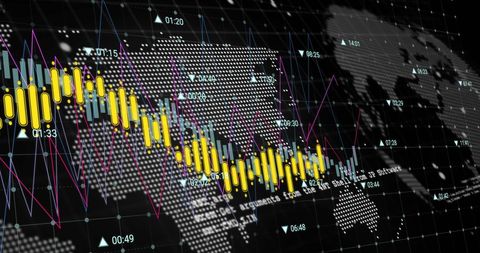
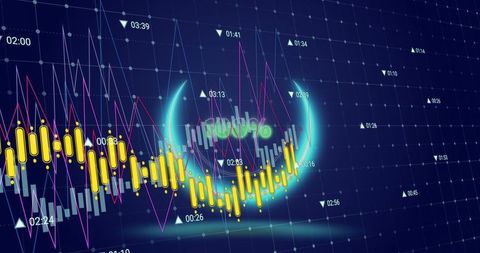
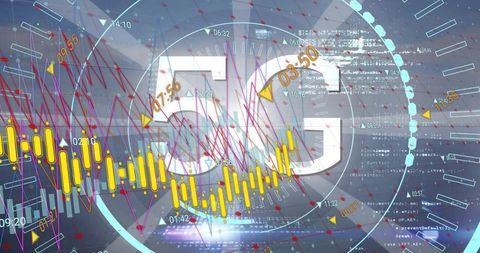
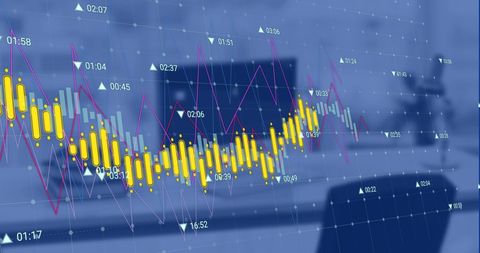
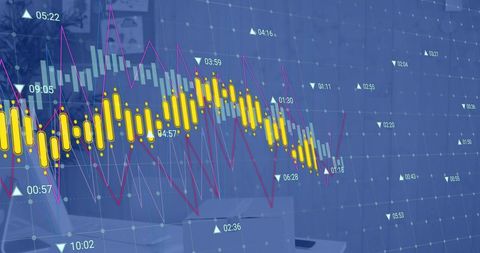
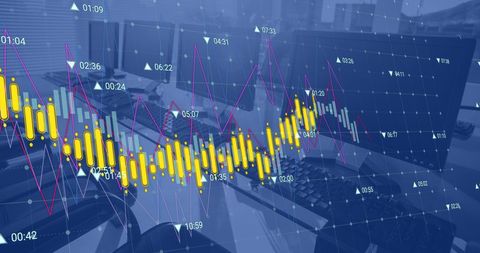
- Digital Financial Analytics with Interactive Data Graphs
Digital Financial Analytics with Interactive Data Graphs Image

Visualization showcases digital graphs with financial data against a high-tech background, emphasizing global finance interplay. Ideal for illustrating articles on financial trends, stock market analysis, and technology in economics. Useful in presentations discussing data-driven decision-making and cryptocurrency evaluations. Visually engages viewers interested in finance and analytics sectors.

downloads
Tags:
More
Credit Photo
If you would like to credit the Photo, here are some ways you can do so
Text Link
photo Link
<span class="text-link">
<span>
<a target="_blank" href=https://pikwizard.com/photo/digital-financial-analytics-with-interactive-data-graphs/f7fb83d43bcca8e4c6ed199bf37c047b/>PikWizard</a>
</span>
</span>
<span class="image-link">
<span
style="margin: 0 0 20px 0; display: inline-block; vertical-align: middle; width: 100%;"
>
<a
target="_blank"
href="https://pikwizard.com/photo/digital-financial-analytics-with-interactive-data-graphs/f7fb83d43bcca8e4c6ed199bf37c047b/"
style="text-decoration: none; font-size: 10px; margin: 0;"
>
<img src="https://pikwizard.com/pw/medium/f7fb83d43bcca8e4c6ed199bf37c047b.jpg" style="margin: 0; width: 100%;" alt="" />
<p style="font-size: 12px; margin: 0;">PikWizard</p>
</a>
</span>
</span>
Free (free of charge)
Free for personal and commercial use.
Author: Authentic Images