- Home >
- Stock Photos >
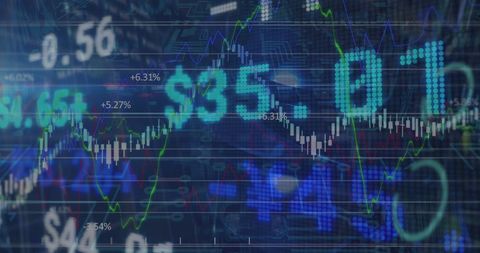
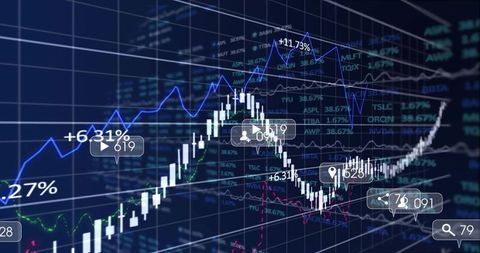
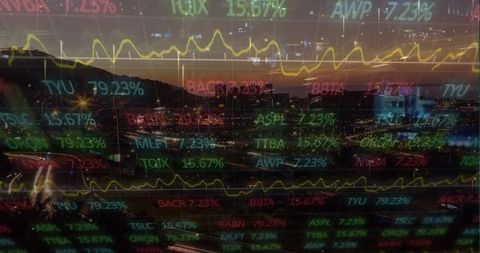
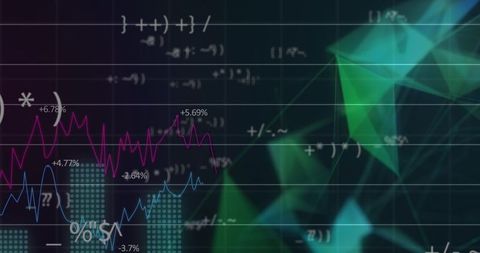
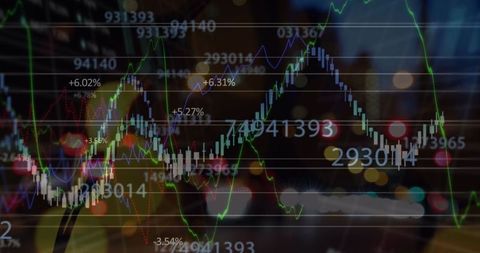
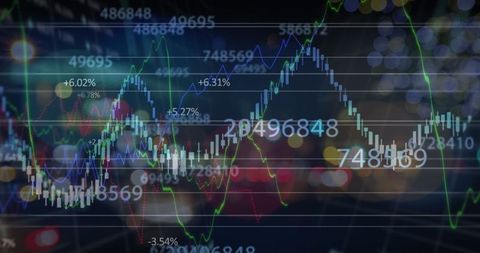
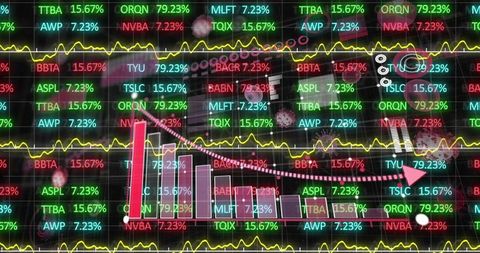
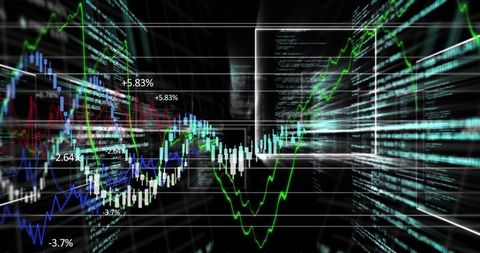
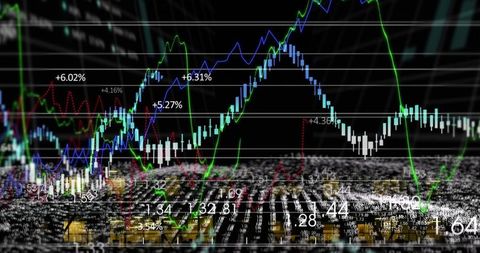
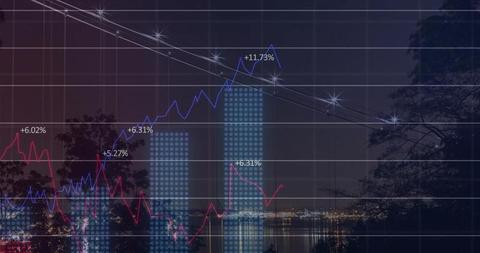
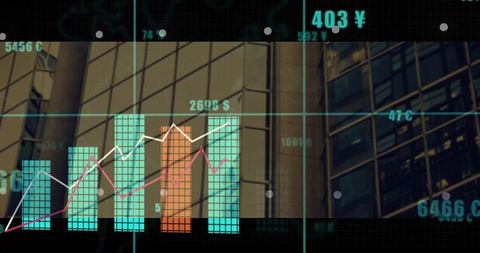
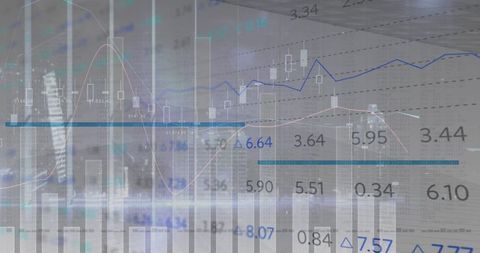
- Digital Financial Analytics with Multiple Chart Indicators
Digital Financial Analytics with Multiple Chart Indicators Image
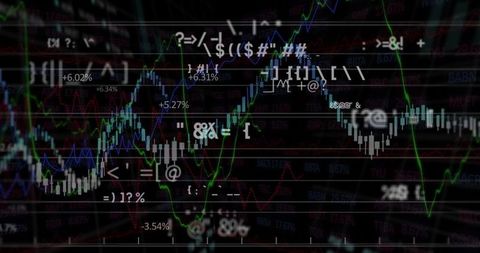
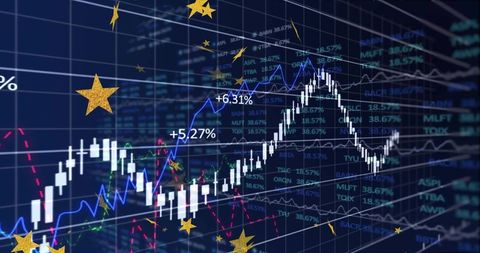
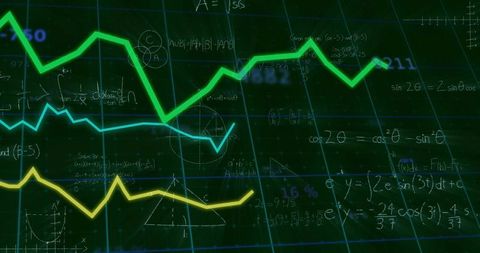
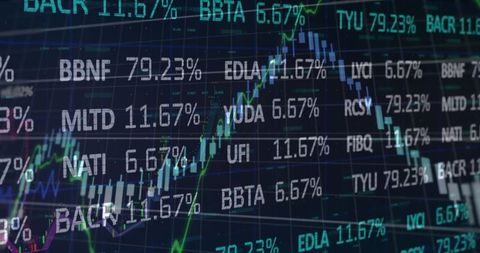
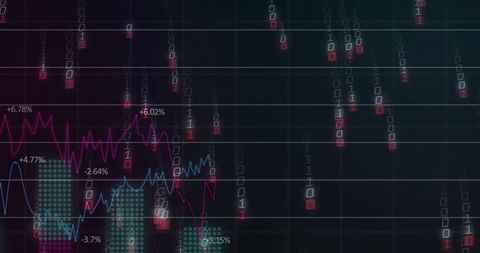
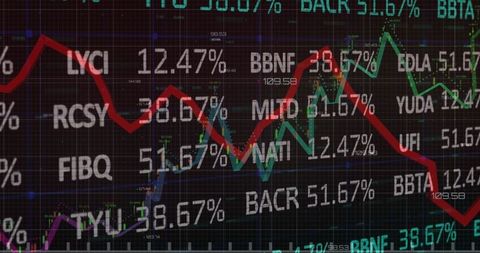
Digitized financial chart showcasing stock market trends with candlestick patterns, percentage labels, and analytic curve lines in blue and green. Useful for presentations on investment strategies, educational materials about market analytics, or as a backdrop for financial discussions and technology-driven trading platforms to visualize trends and market movements.

downloads
Tags:
More
Credit Photo
If you would like to credit the Photo, here are some ways you can do so
Text Link
photo Link
<span class="text-link">
<span>
<a target="_blank" href=https://pikwizard.com/photo/digital-financial-analytics-with-multiple-chart-indicators/6587c0a2898a86292ae9874248120b1b/>PikWizard</a>
</span>
</span>
<span class="image-link">
<span
style="margin: 0 0 20px 0; display: inline-block; vertical-align: middle; width: 100%;"
>
<a
target="_blank"
href="https://pikwizard.com/photo/digital-financial-analytics-with-multiple-chart-indicators/6587c0a2898a86292ae9874248120b1b/"
style="text-decoration: none; font-size: 10px; margin: 0;"
>
<img src="https://pikwizard.com/pw/medium/6587c0a2898a86292ae9874248120b1b.jpg" style="margin: 0; width: 100%;" alt="" />
<p style="font-size: 12px; margin: 0;">PikWizard</p>
</a>
</span>
</span>
Free (free of charge)
Free for personal and commercial use.
Author: Awesome Content