
- Home >
- Stock Photos >
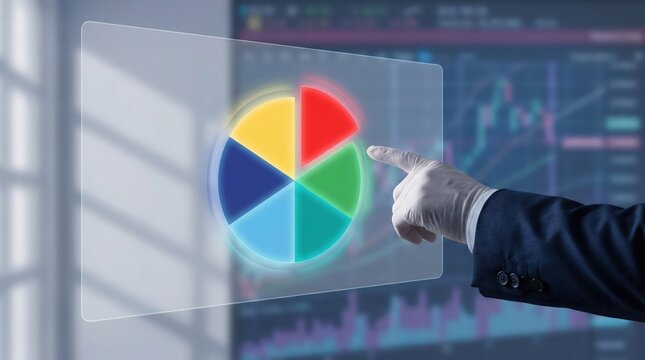
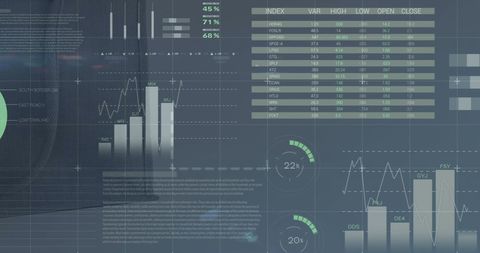
- Digital Financial Analytics with Real-time Data Processing
Digital Financial Analytics with Real-time Data Processing Image

Perfect for illustrating articles or presentations on financial data analytics, digital transformation in finance, or global business trends. Useful for websites focusing on fintech, investments, data processing technologies, or market forecast reports. Engaging background for business professionals, analysts, and educational content featuring economics or computing advancements.
Powered by 


downloads
Tags:
More
Credit Photo
If you would like to credit the Photo, here are some ways you can do so
Text Link
photo Link
<span class="text-link">
<span>
<a target="_blank" href=https://pikwizard.com/photo/digital-financial-analytics-with-real-time-data-processing/29cf725f60729300b34c85f0a06acf07/>PikWizard</a>
</span>
</span>
<span class="image-link">
<span
style="margin: 0 0 20px 0; display: inline-block; vertical-align: middle; width: 100%;"
>
<a
target="_blank"
href="https://pikwizard.com/photo/digital-financial-analytics-with-real-time-data-processing/29cf725f60729300b34c85f0a06acf07/"
style="text-decoration: none; font-size: 10px; margin: 0;"
>
<img src="https://pikwizard.com/pw/medium/29cf725f60729300b34c85f0a06acf07.jpg" style="margin: 0; width: 100%;" alt="" />
<p style="font-size: 12px; margin: 0;">PikWizard</p>
</a>
</span>
</span>
Free (free of charge)
Free for personal and commercial use.
Author: Authentic Images
Similar Free Stock Images

Premium


Premium


Premium

Premium


Premium


Premium


Premium


Premium

Premium


Premium


Premium


Premium


Premium


Premium


Premium


Premium
Premium


Premium


Premium


Premium


Premium


Premium

Premium


Premium


Premium


Explore More Free Stock Images