
- Home >
- Stock Photos >
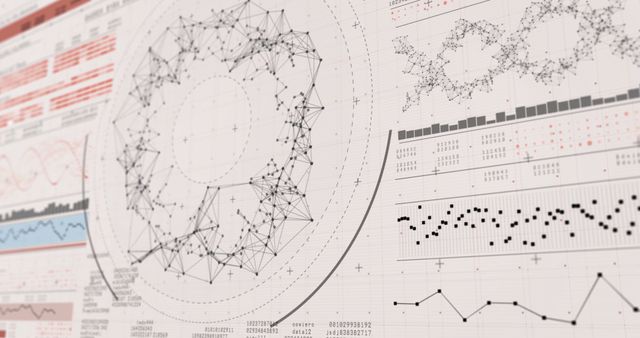
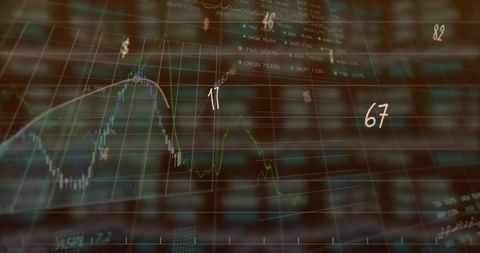
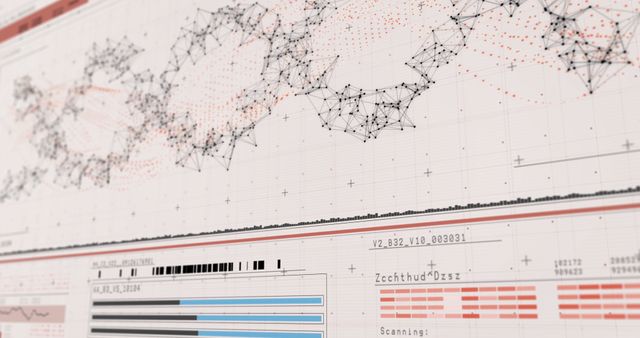
- Digital Financial Chart Analysis Background
Digital Financial Chart Analysis Background Image

Complex data charts and graphs illustrated over a blue background depicting global business and digital interfaces. Ideal for use in presentations on finance, stock market analysis, economic trends, or digital technology discussions. Suitable for enhancing content regarding financial analytics, global markets, or investment strategies.
Powered by 


downloads
Tags:
More
Credit Photo
If you would like to credit the Photo, here are some ways you can do so
Text Link
photo Link
<span class="text-link">
<span>
<a target="_blank" href=https://pikwizard.com/photo/digital-financial-chart-analysis-background/adb8cc755167f8bbb121425e48ca2a86/>PikWizard</a>
</span>
</span>
<span class="image-link">
<span
style="margin: 0 0 20px 0; display: inline-block; vertical-align: middle; width: 100%;"
>
<a
target="_blank"
href="https://pikwizard.com/photo/digital-financial-chart-analysis-background/adb8cc755167f8bbb121425e48ca2a86/"
style="text-decoration: none; font-size: 10px; margin: 0;"
>
<img src="https://pikwizard.com/pw/medium/adb8cc755167f8bbb121425e48ca2a86.jpg" style="margin: 0; width: 100%;" alt="" />
<p style="font-size: 12px; margin: 0;">PikWizard</p>
</a>
</span>
</span>
Free (free of charge)
Free for personal and commercial use.
Author: Awesome Content
Similar Free Stock Images

Premium


Premium


Premium


Premium


Premium


Premium

Premium


Premium


Premium

Premium


Premium

Premium


Premium


Premium


Premium


Premium


Premium


Premium


Premium


Premium


Premium


Premium

Premium


Premium


Premium


Explore More Free Stock Images