- Home >
- Stock Photos >
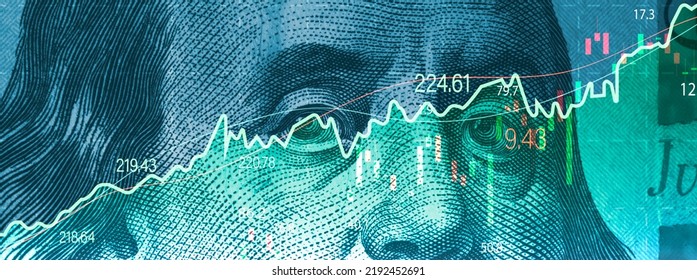
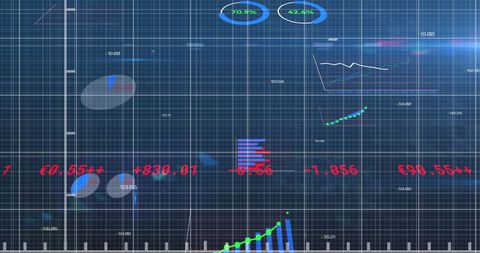
- Digital Financial Chart and Global Currency Symbols on Blue Background
Digital Financial Chart and Global Currency Symbols on Blue Background Image

Diverse financial charts and currency symbols displayed against a blue background convey a global economic theme. Ideal for use in presentations about economic trends, financial trends and business analyses or on websites related to finance and investment news.
Powered by  - Get 15% off with code: PIKWIZARD15


2
downloads
downloads
Tags:
More
Credit Photo
If you would like to credit the Photo, here are some ways you can do so
Text Link
photo Link
<span class="text-link">
<span>
<a target="_blank" href=https://pikwizard.com/photo/digital-financial-chart-and-global-currency-symbols-on-blue-background/e655dff77532ea3ec6e01aebe57a2600/>PikWizard</a>
</span>
</span>
<span class="image-link">
<span
style="margin: 0 0 20px 0; display: inline-block; vertical-align: middle; width: 100%;"
>
<a
target="_blank"
href="https://pikwizard.com/photo/digital-financial-chart-and-global-currency-symbols-on-blue-background/e655dff77532ea3ec6e01aebe57a2600/"
style="text-decoration: none; font-size: 10px; margin: 0;"
>
<img src="https://pikwizard.com/pw/medium/e655dff77532ea3ec6e01aebe57a2600.jpg" style="margin: 0; width: 100%;" alt="" />
<p style="font-size: 12px; margin: 0;">PikWizard</p>
</a>
</span>
</span>
Free (free of charge)
Free for personal and commercial use.
Author: Creative Art
Similar Free Stock Images
Loading...

Premium


Premium


Premium


Premium


Premium

Premium

Premium

Premium

Premium


Premium


Premium


Premium


Premium

Premium

Premium


Premium


Premium


Premium


Premium

Premium

Premium


Premium

Premium


Premium


Premium