
- Home >
- Stock Photos >
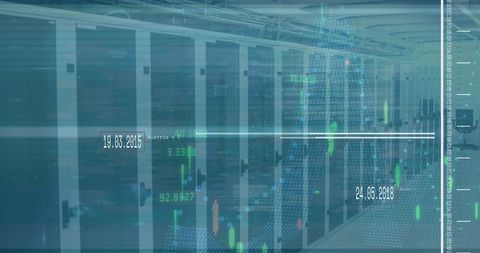
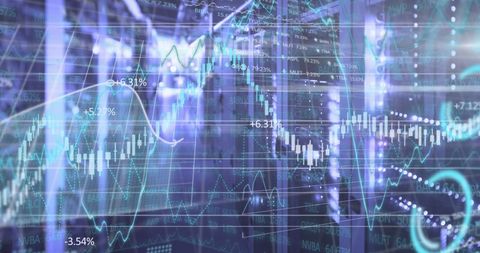
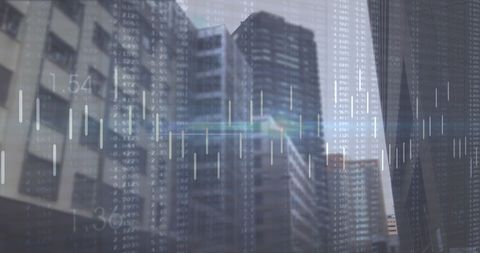
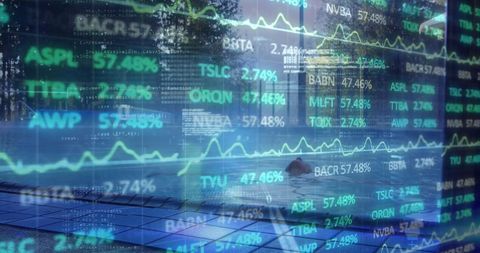
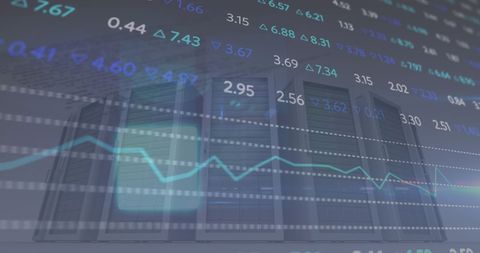
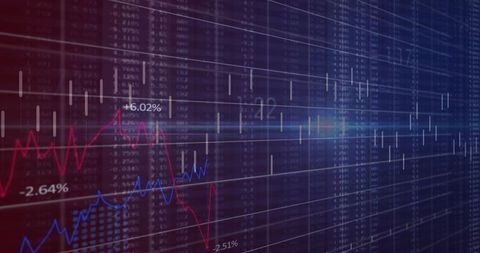
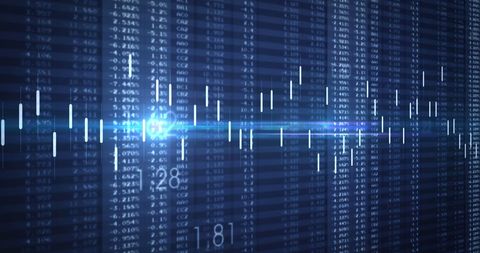
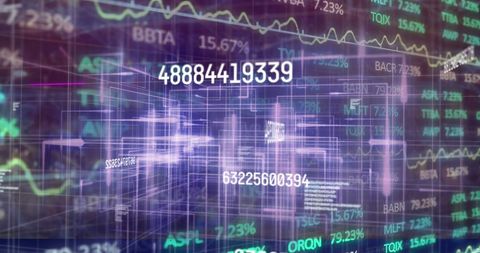
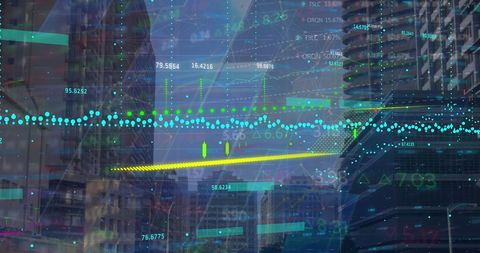
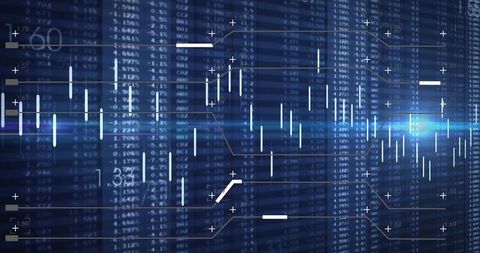
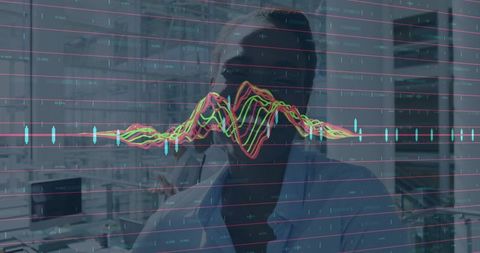
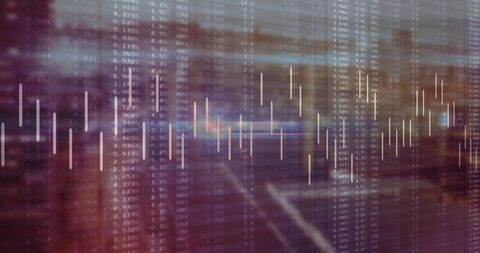
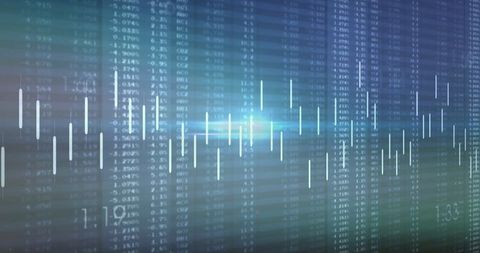
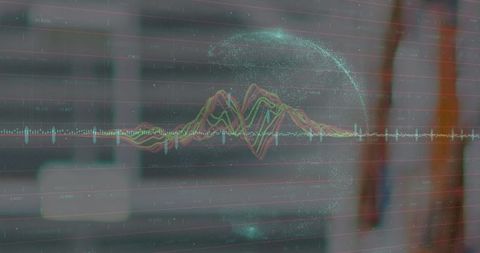
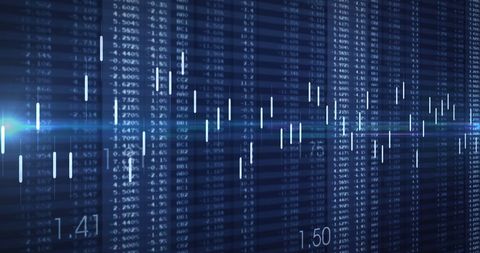
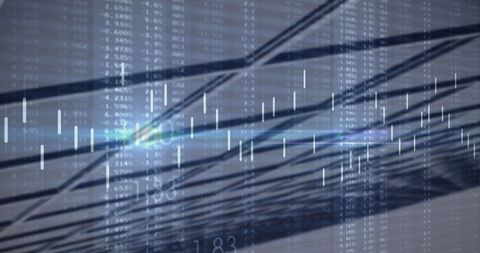
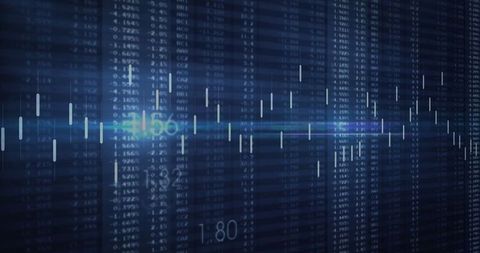
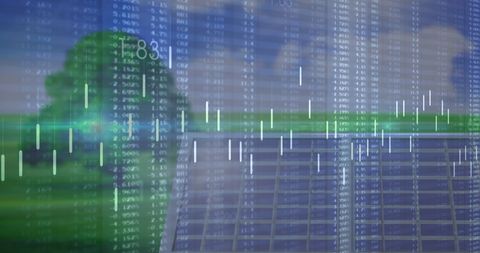
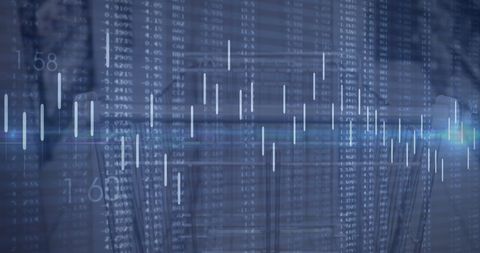
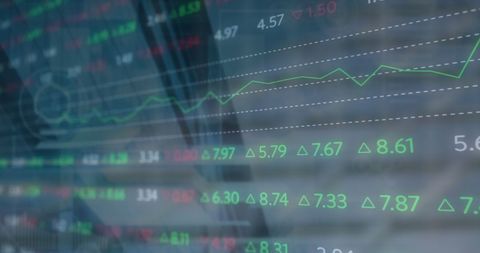
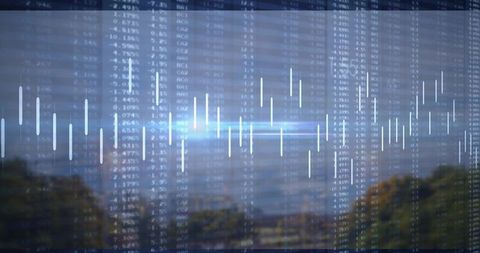
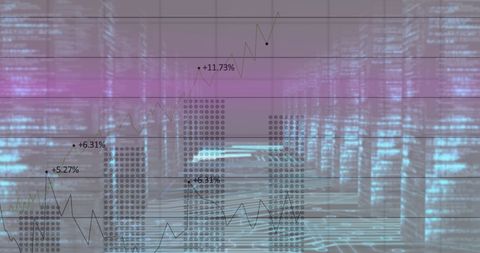
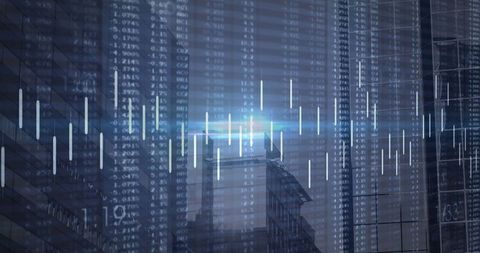
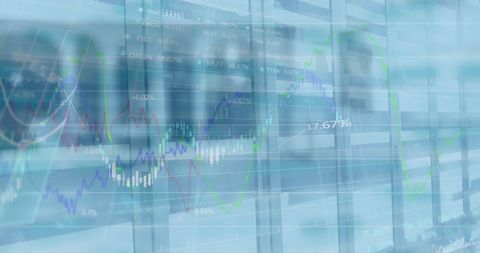
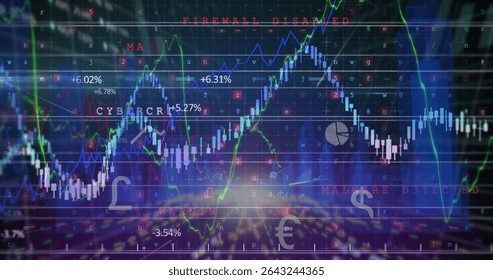
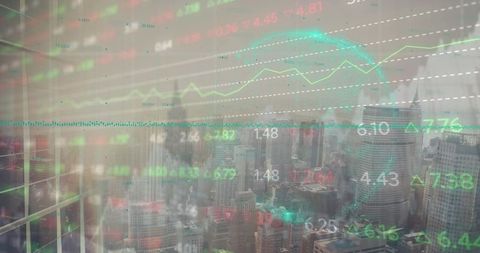
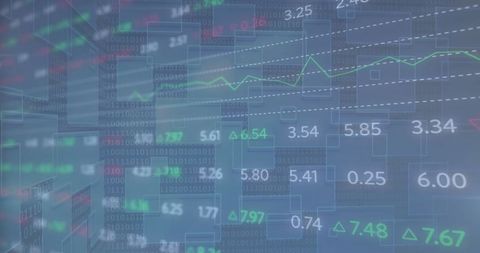
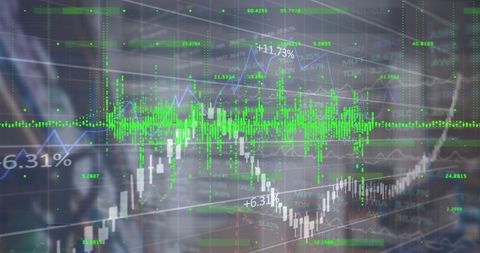
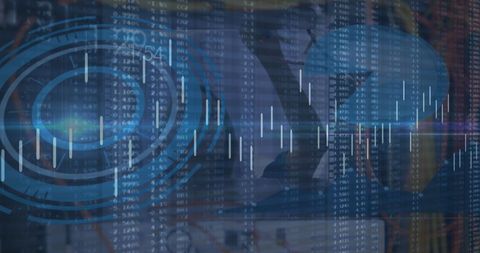
- Digital Financial Chart Display with Candlestick Bars
Digital Financial Chart Display with Candlestick Bars Image
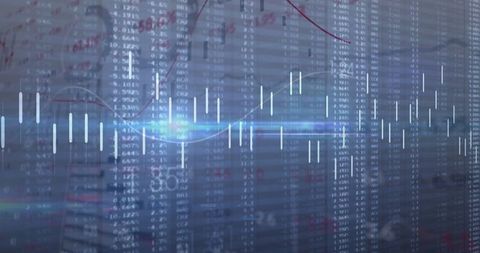
Image showcases a dynamic financial dashboard screen with candlestick charts and waveforms for data analysis. Ideal for articles on finance, stock market trends, investment skills, and profit monitoring. Useful in illustrating economic data analytics and digital trading solutions.
Powered by  - Get 15% off with code: PIKWIZARD15


downloads
Tags:
More
Credit Photo
If you would like to credit the Photo, here are some ways you can do so
Text Link
photo Link
<span class="text-link">
<span>
<a target="_blank" href=https://pikwizard.com/photo/digital-financial-chart-display-with-candlestick-bars/25729f21b1bbba84b1a5fcf71d50be46/>PikWizard</a>
</span>
</span>
<span class="image-link">
<span
style="margin: 0 0 20px 0; display: inline-block; vertical-align: middle; width: 100%;"
>
<a
target="_blank"
href="https://pikwizard.com/photo/digital-financial-chart-display-with-candlestick-bars/25729f21b1bbba84b1a5fcf71d50be46/"
style="text-decoration: none; font-size: 10px; margin: 0;"
>
<img src="https://pikwizard.com/pw/medium/25729f21b1bbba84b1a5fcf71d50be46.jpg" style="margin: 0; width: 100%;" alt="" />
<p style="font-size: 12px; margin: 0;">PikWizard</p>
</a>
</span>
</span>
Free (free of charge)
Free for personal and commercial use.
Author: Authentic Images
Similar Free Stock Images
Premium


Premium


Premium


Premium

Premium


Premium

Premium

Premium

Premium


Premium


Premium


Premium


Premium

Premium

Premium


Premium


Premium


Premium

Premium

Premium


Premium

Premium


Premium


Premium

Premium

Explore More Free Stock Images