- Home >
- Stock Photos >
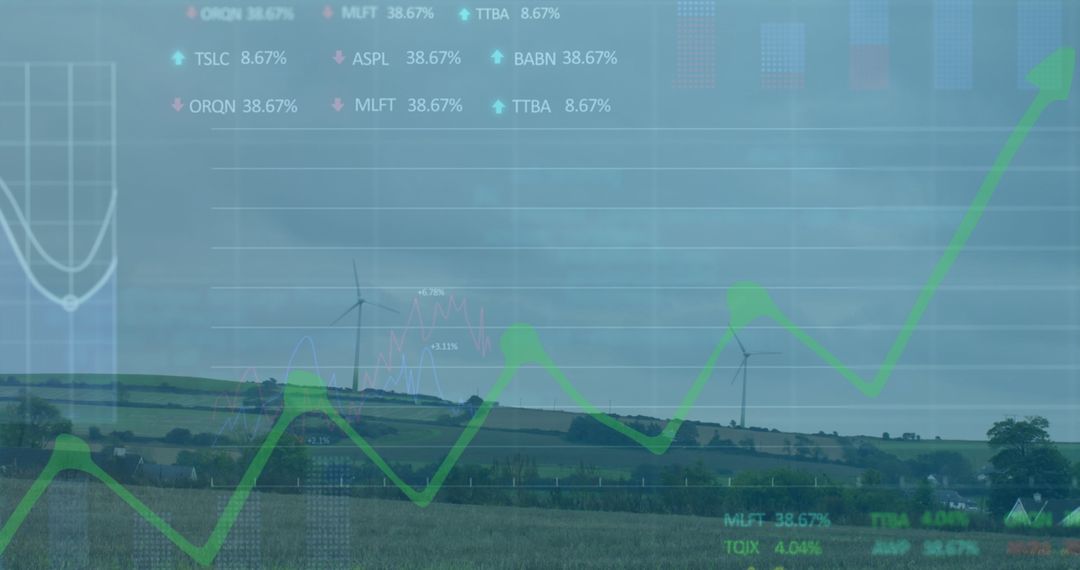
- Digital Financial Chart Overlapping Cityscape and Countryside
Digital Financial Chart Overlapping Cityscape and Countryside Image

Graph displaying green and yellow lines atop digital grid, layering over urban cityscape and mountainous backdrop. Represents integration of finance and technology, providing insights into modern investment trends. Useful for business presentations related to financial data analysis, market trends, or technological advancements in fintech.
Powered by 


2
downloads
downloads
Tags:
More
Credit Photo
If you would like to credit the Photo, here are some ways you can do so
Text Link
photo Link
<span class="text-link">
<span>
<a target="_blank" href=https://pikwizard.com/photo/digital-financial-chart-overlapping-cityscape-and-countryside/3314e54175fecfc5ea9ea3ef723a83a3/>PikWizard</a>
</span>
</span>
<span class="image-link">
<span
style="margin: 0 0 20px 0; display: inline-block; vertical-align: middle; width: 100%;"
>
<a
target="_blank"
href="https://pikwizard.com/photo/digital-financial-chart-overlapping-cityscape-and-countryside/3314e54175fecfc5ea9ea3ef723a83a3/"
style="text-decoration: none; font-size: 10px; margin: 0;"
>
<img src="https://pikwizard.com/pw/medium/3314e54175fecfc5ea9ea3ef723a83a3.jpg" style="margin: 0; width: 100%;" alt="" />
<p style="font-size: 12px; margin: 0;">PikWizard</p>
</a>
</span>
</span>
Free (free of charge)
Free for personal and commercial use.
Author: People Creations
Similar Free Stock Images

Premium


Premium


Premium


Premium


Premium


Premium


Premium


Premium


Premium


Premium


Premium


Premium


Premium


Premium


Premium


Premium


Premium


Premium


Premium


Premium


Premium


Premium


Premium


Premium