
- Home >
- Stock Photos >
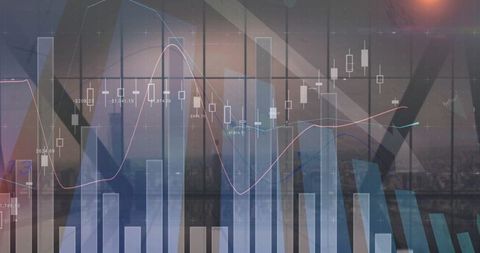
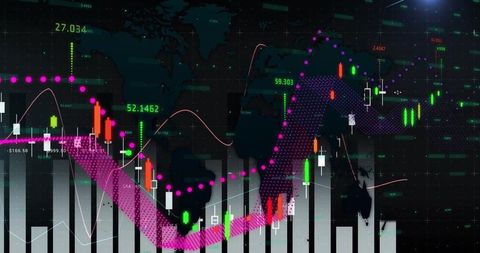
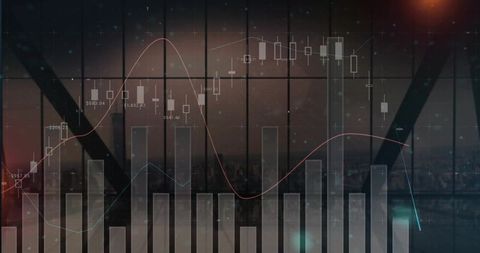
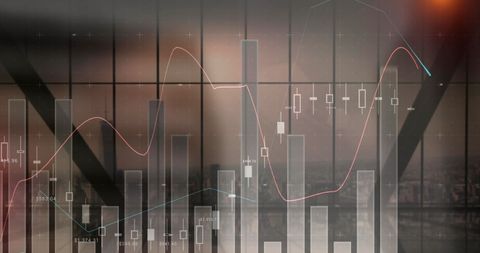
- Digital Financial Chart Showing Market Trends with Candlestick Bars
Digital Financial Chart Showing Market Trends with Candlestick Bars Image
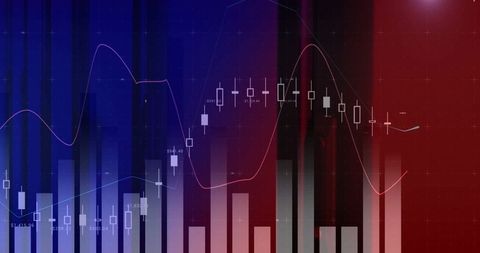
Illuminates digital financial analytics with candlestick bars reflecting market movements on a trading platform. This depiction serves essential for understanding investment strategies, exploring data-driven decisions, or illustrating economic trends in modern business environments. Helpful for presentations in finance, technology sectors, or with detailed financial reports.
Powered by  - Get 15% off with code: PIKWIZARD15


0
downloads
downloads
Tags:
More
Credit Photo
If you would like to credit the Photo, here are some ways you can do so
Text Link
photo Link
<span class="text-link">
<span>
<a target="_blank" href=https://pikwizard.com/photo/digital-financial-chart-showing-market-trends-with-candlestick-bars/61353146ecc22db77a4fa2adc85f2d49/>PikWizard</a>
</span>
</span>
<span class="image-link">
<span
style="margin: 0 0 20px 0; display: inline-block; vertical-align: middle; width: 100%;"
>
<a
target="_blank"
href="https://pikwizard.com/photo/digital-financial-chart-showing-market-trends-with-candlestick-bars/61353146ecc22db77a4fa2adc85f2d49/"
style="text-decoration: none; font-size: 10px; margin: 0;"
>
<img src="https://pikwizard.com/pw/medium/61353146ecc22db77a4fa2adc85f2d49.jpg" style="margin: 0; width: 100%;" alt="" />
<p style="font-size: 12px; margin: 0;">PikWizard</p>
</a>
</span>
</span>
Free (free of charge)
Free for personal and commercial use.
Author: Awesome Content
Similar Free Stock Images
Loading...

Premium


Premium

Premium


Premium


Premium

Premium


Premium


Premium
Premium


Premium


Premium

Premium


Premium


Premium


Premium


Premium


Premium


Premium


Premium


Premium


Premium


Premium

Premium


Premium


Premium


