
- Home >
- Stock Photos >
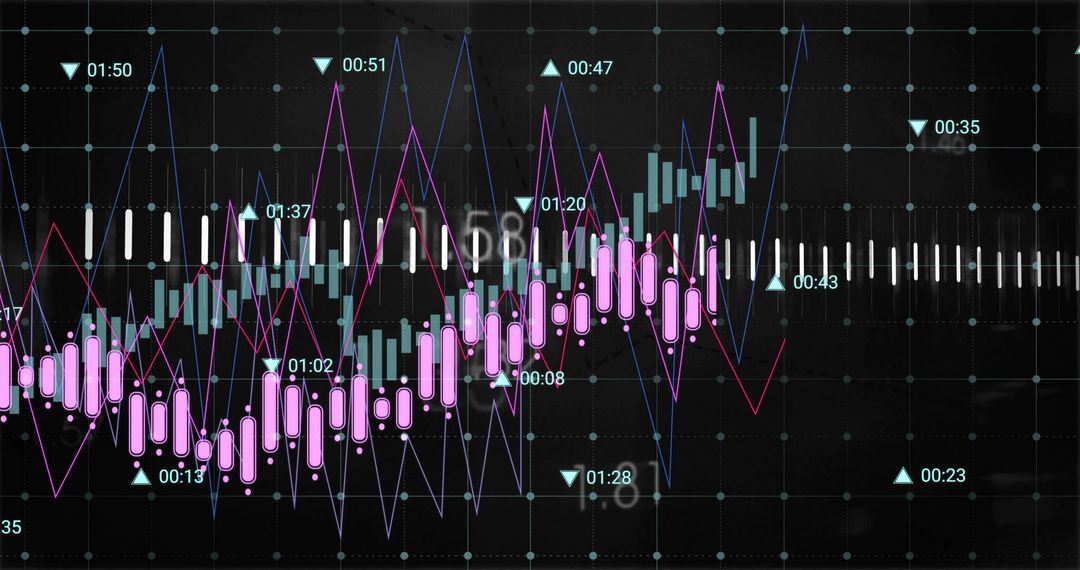
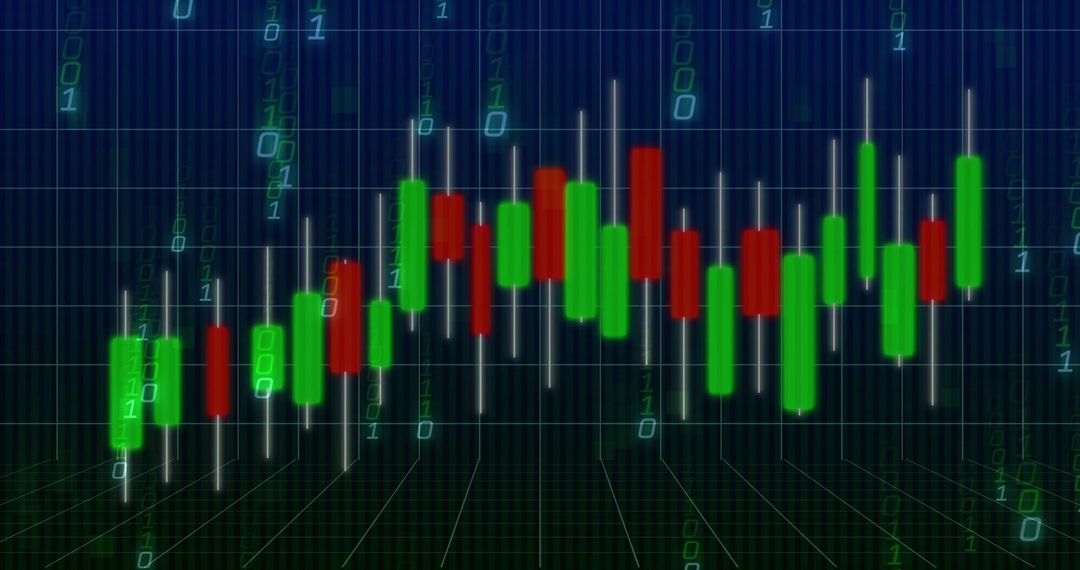
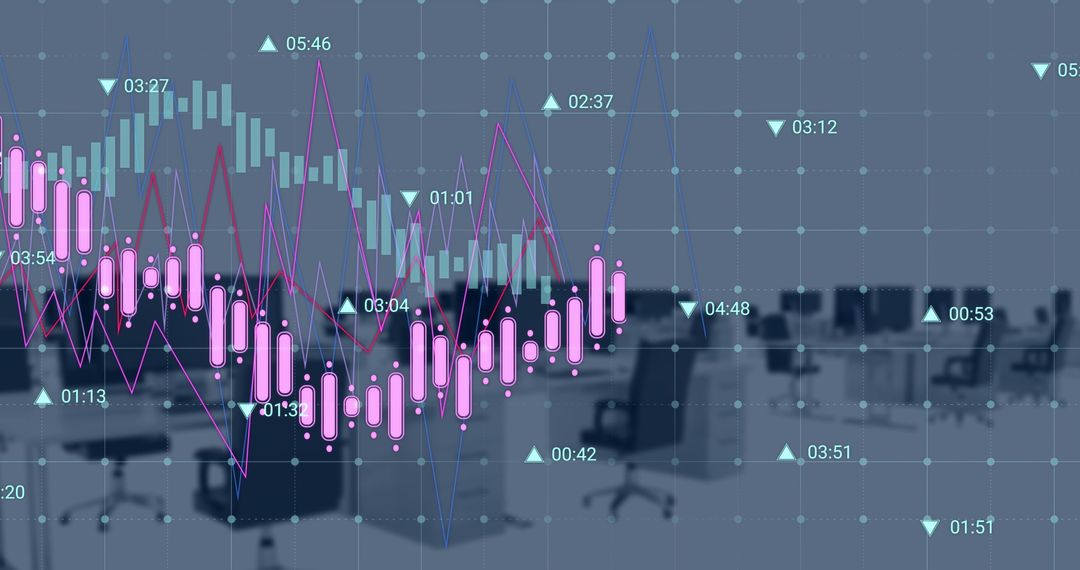
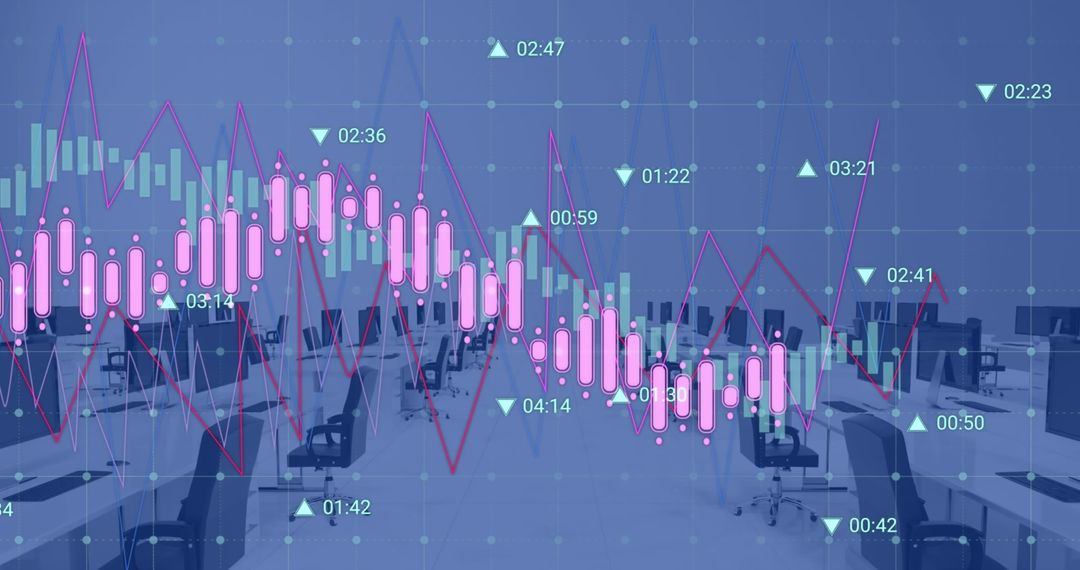
- Digital Financial Chart with Candlesticks and Line Graphs for Market Analysis
Digital Financial Chart with Candlesticks and Line Graphs for Market Analysis Image

Digital chart with pink and cyan candlesticks and magenta lines used for depicting market data trends. Ideal for illustrating concepts in financial analysis, stock investment, and economic forecasting. Useful in articles, blogs, and presentations on digital interfaces used in financial trading.
Powered by  - Get 15% off with code: PIKWIZARD15


2
downloads
downloads
Tags:
More
Credit Photo
If you would like to credit the Photo, here are some ways you can do so
Text Link
photo Link
<span class="text-link">
<span>
<a target="_blank" href=https://pikwizard.com/photo/digital-financial-chart-with-candlesticks-and-line-graphs-for-market-analysis/cd0e3036e337672ff285276a04dac90a/>PikWizard</a>
</span>
</span>
<span class="image-link">
<span
style="margin: 0 0 20px 0; display: inline-block; vertical-align: middle; width: 100%;"
>
<a
target="_blank"
href="https://pikwizard.com/photo/digital-financial-chart-with-candlesticks-and-line-graphs-for-market-analysis/cd0e3036e337672ff285276a04dac90a/"
style="text-decoration: none; font-size: 10px; margin: 0;"
>
<img src="https://pikwizard.com/pw/medium/cd0e3036e337672ff285276a04dac90a.jpg" style="margin: 0; width: 100%;" alt="" />
<p style="font-size: 12px; margin: 0;">PikWizard</p>
</a>
</span>
</span>
Free (free of charge)
Free for personal and commercial use.
Author: People Creations
Similar Free Stock Images
Premium


Premium


Premium


Premium


Premium


Premium


Premium


Premium


Premium


Premium


Premium


Premium


Premium


Premium


Premium


Premium


Premium


Premium


Premium


Premium


Premium


Premium


Premium


Premium

