- Home >
- Stock Photos >
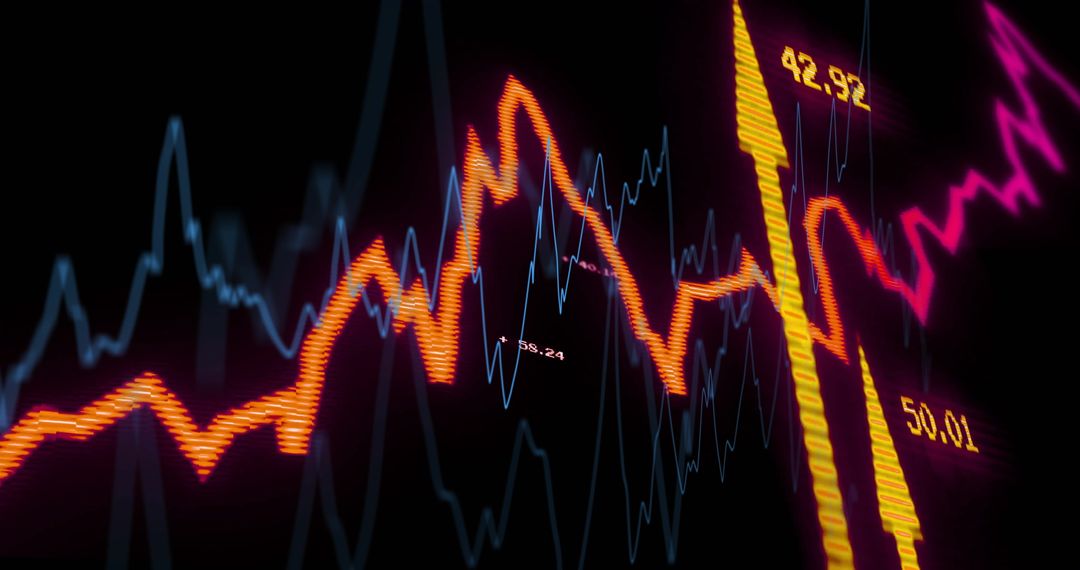
- Digital Financial Chart with Fluctuating Graphs and Indicators
Digital Financial Chart with Fluctuating Graphs and Indicators Image

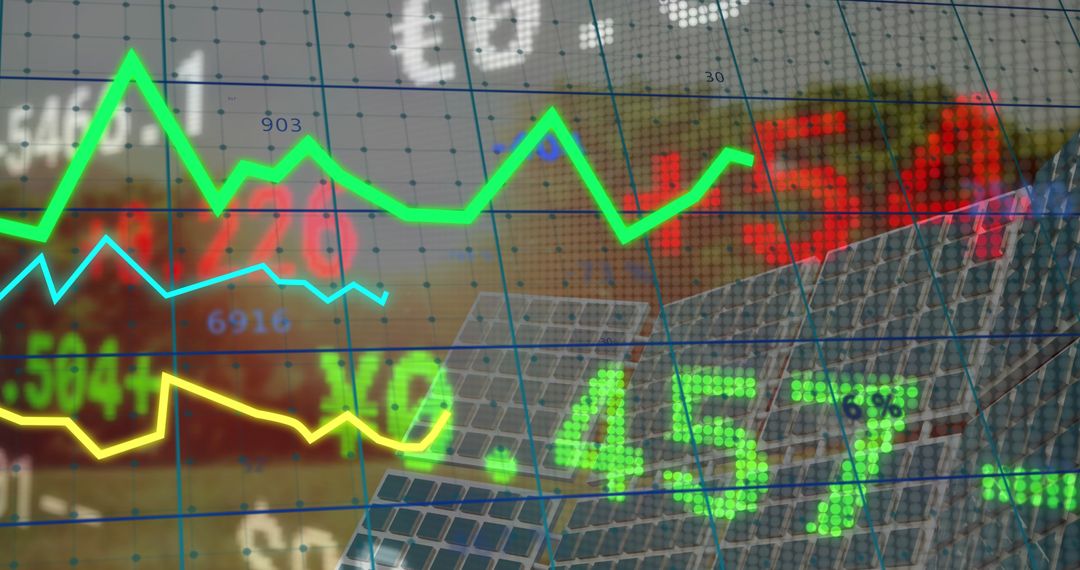
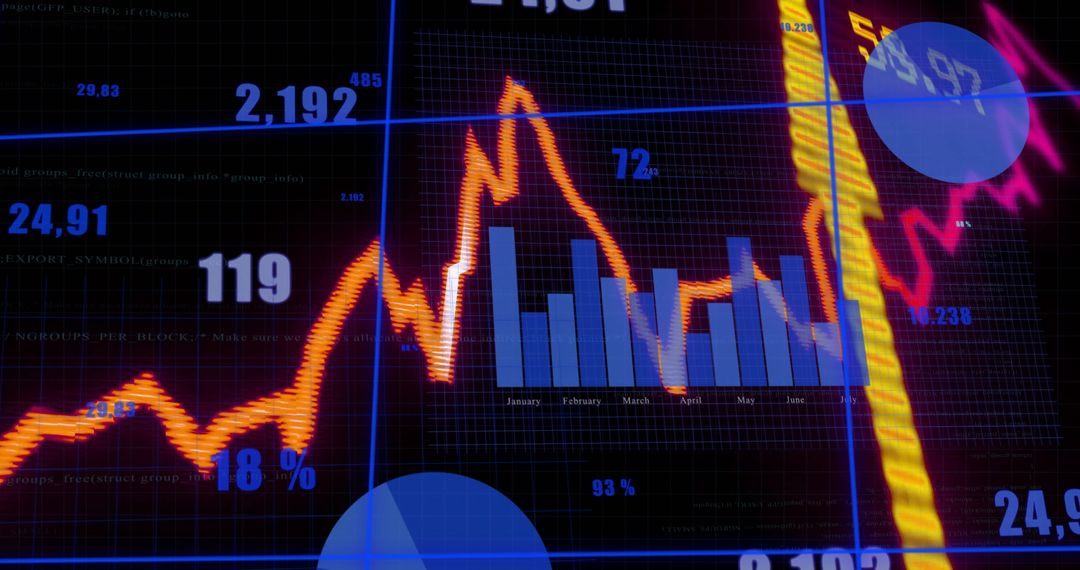
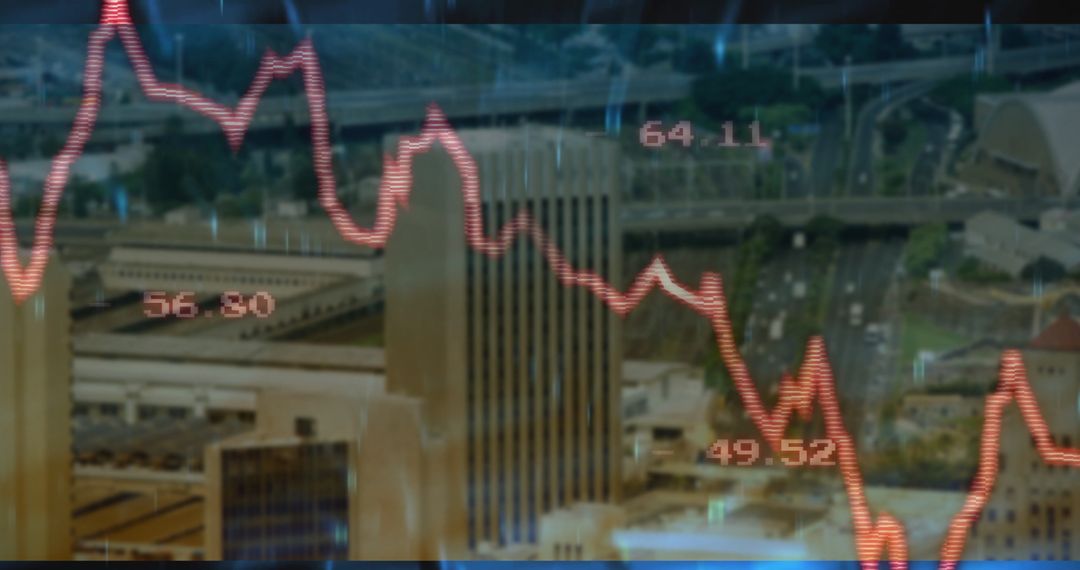
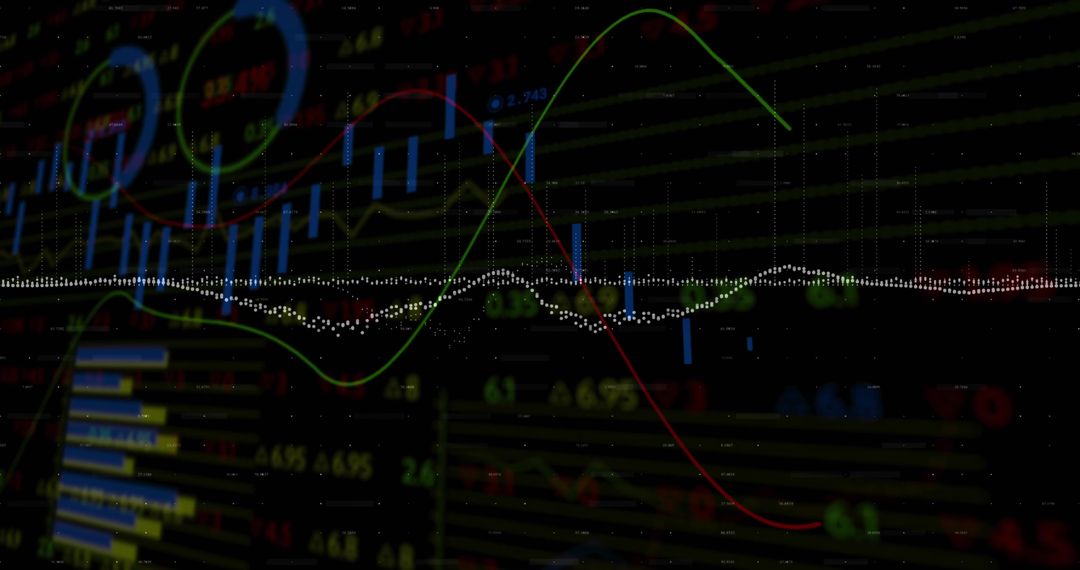
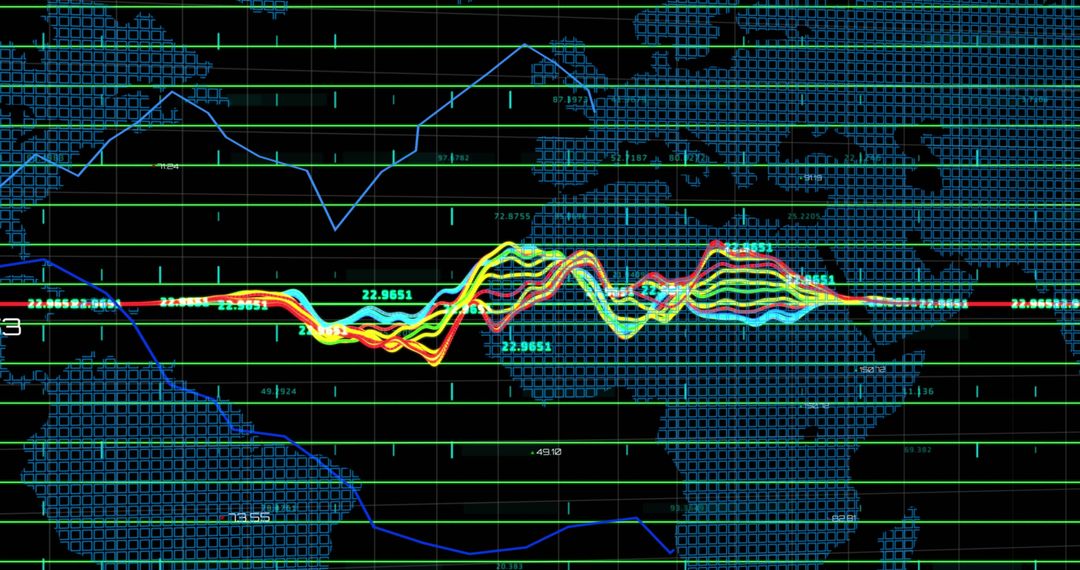
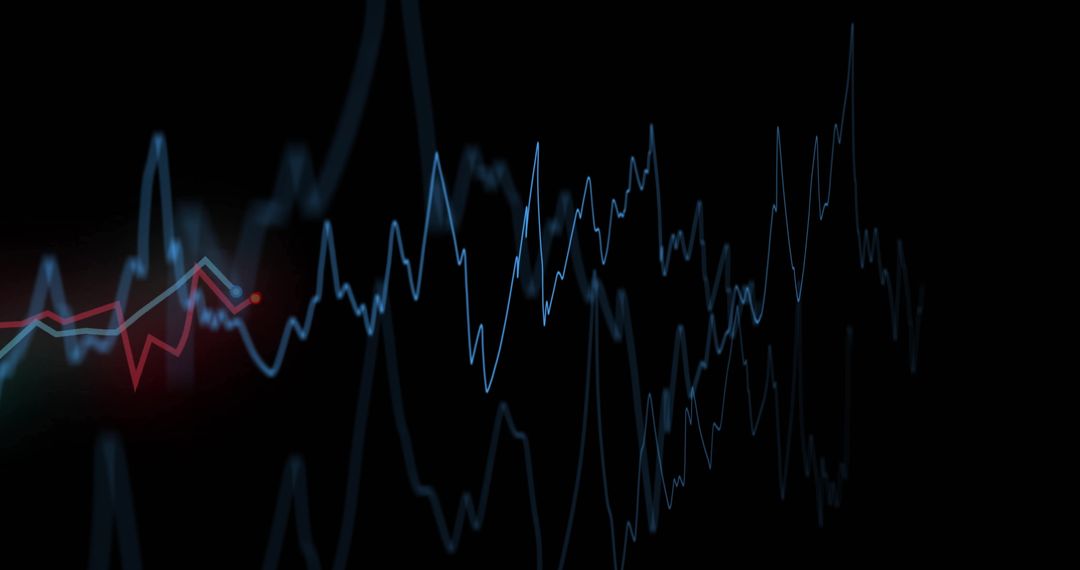
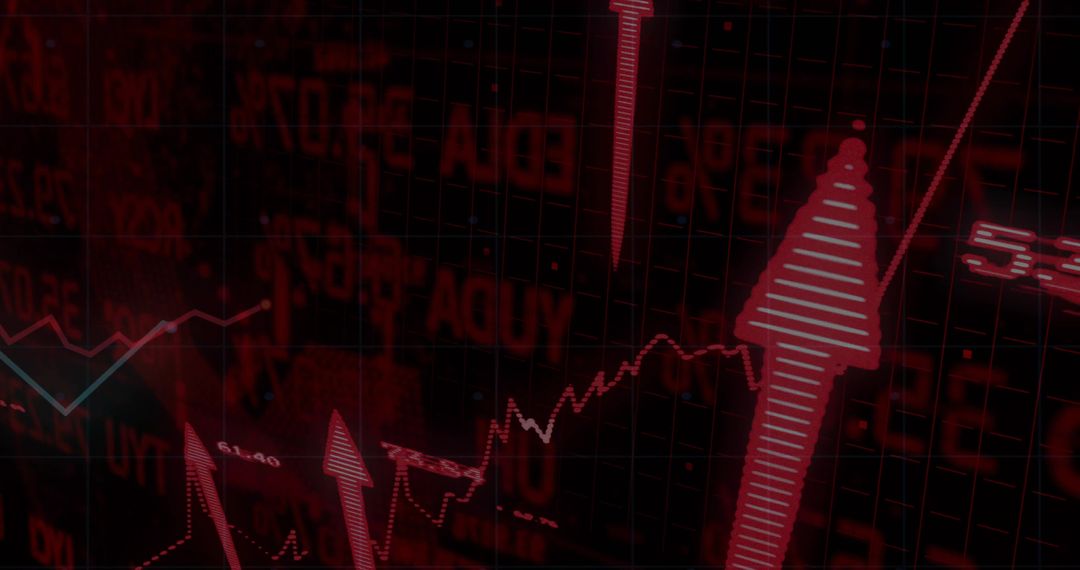
This visual illustrates a detailed financial chart featuring red and blue fluctuating graphs with upward-pointing arrows, symbolizing market analysis and trends. Suitable for illustrating topics related to finance, investment strategies, stock market analyses, and economic performance. Ideal for presentations, articles, or educational material emphasizing data precision, market prediction, and financial planning strategies.
Powered by  - Get 15% off with code: PIKWIZARD15


2
downloads
downloads
Tags:
More
Credit Photo
If you would like to credit the Photo, here are some ways you can do so
Text Link
photo Link
<span class="text-link">
<span>
<a target="_blank" href=https://pikwizard.com/photo/digital-financial-chart-with-fluctuating-graphs-and-indicators/be0ac3facc196198d0813670583701fb/>PikWizard</a>
</span>
</span>
<span class="image-link">
<span
style="margin: 0 0 20px 0; display: inline-block; vertical-align: middle; width: 100%;"
>
<a
target="_blank"
href="https://pikwizard.com/photo/digital-financial-chart-with-fluctuating-graphs-and-indicators/be0ac3facc196198d0813670583701fb/"
style="text-decoration: none; font-size: 10px; margin: 0;"
>
<img src="https://pikwizard.com/pw/medium/be0ac3facc196198d0813670583701fb.jpg" style="margin: 0; width: 100%;" alt="" />
<p style="font-size: 12px; margin: 0;">PikWizard</p>
</a>
</span>
</span>
Free (free of charge)
Free for personal and commercial use.
Author: Creative Art
Similar Free Stock Images

Premium


Premium


Premium


Premium


Premium


Premium


Premium


Premium


Premium


Premium


Premium


Premium


Premium


Premium


Premium


Premium


Premium


Premium


Premium


Premium


Premium


Premium


Premium


Premium