- Home >
- Stock Photos >
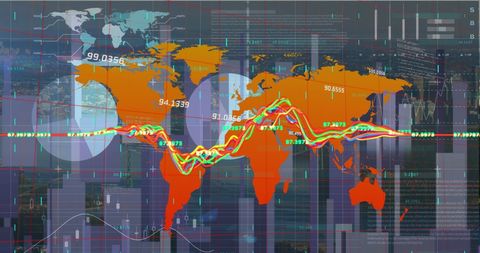
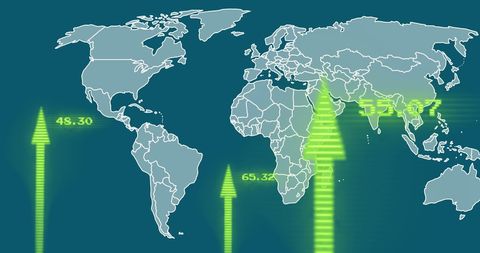
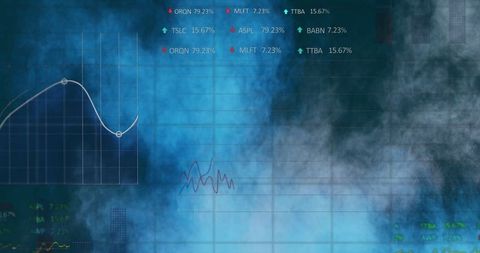
- Digital Financial Chart with Graphs and Data Visualization
Digital Financial Chart with Graphs and Data Visualization Image

This image shows a dynamic blend of digital bar and line graphs, coupled with pie charts, to convey financial and analytic data effectively. Colors mix with analytics symbols representing currency and temperature metrics. Ideal for professionals in finance, business strategy presentations, digital marketing materials related to technology, and analyses. Useful for illustrating articles about financial trends or showcasing corporate analytics tools.

downloads
Tags:
More
Credit Photo
If you would like to credit the Photo, here are some ways you can do so
Text Link
photo Link
<span class="text-link">
<span>
<a target="_blank" href=https://pikwizard.com/photo/digital-financial-chart-with-graphs-and-data-visualization/266c7ad2e2e735be9e40fb86f52baaec/>PikWizard</a>
</span>
</span>
<span class="image-link">
<span
style="margin: 0 0 20px 0; display: inline-block; vertical-align: middle; width: 100%;"
>
<a
target="_blank"
href="https://pikwizard.com/photo/digital-financial-chart-with-graphs-and-data-visualization/266c7ad2e2e735be9e40fb86f52baaec/"
style="text-decoration: none; font-size: 10px; margin: 0;"
>
<img src="https://pikwizard.com/pw/medium/266c7ad2e2e735be9e40fb86f52baaec.jpg" style="margin: 0; width: 100%;" alt="" />
<p style="font-size: 12px; margin: 0;">PikWizard</p>
</a>
</span>
</span>
Free (free of charge)
Free for personal and commercial use.
Author: People Creations