
- Home >
- Stock Photos >
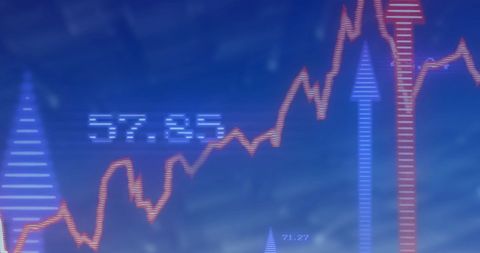
- Digital Financial Chart with Increasing Graph
Digital Financial Chart with Increasing Graph Image

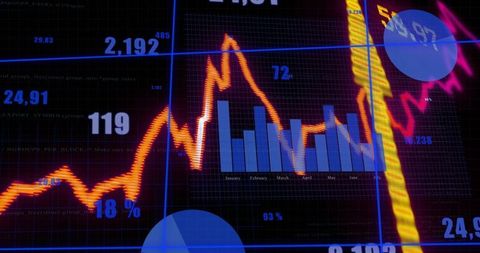
Bright digital chart displaying financial growth with arrows and fluctuating graphs is ideal for illustrating market success, trading strategies, and investment analysis. Useful for websites, reports, or presentations focused on finance, stock market predictions, and economic trends.
Powered by  - Get 15% off with code: PIKWIZARD15


downloads
Tags:
More
Credit Photo
If you would like to credit the Photo, here are some ways you can do so
Text Link
photo Link
<span class="text-link">
<span>
<a target="_blank" href=https://pikwizard.com/photo/digital-financial-chart-with-increasing-graph/8ad5b623bca4bc34c090f975c19c0b14/>PikWizard</a>
</span>
</span>
<span class="image-link">
<span
style="margin: 0 0 20px 0; display: inline-block; vertical-align: middle; width: 100%;"
>
<a
target="_blank"
href="https://pikwizard.com/photo/digital-financial-chart-with-increasing-graph/8ad5b623bca4bc34c090f975c19c0b14/"
style="text-decoration: none; font-size: 10px; margin: 0;"
>
<img src="https://pikwizard.com/pw/medium/8ad5b623bca4bc34c090f975c19c0b14.jpg" style="margin: 0; width: 100%;" alt="" />
<p style="font-size: 12px; margin: 0;">PikWizard</p>
</a>
</span>
</span>
Free (free of charge)
Free for personal and commercial use.
Author: People Creations
Similar Free Stock Images

Premium


Premium


Premium


Premium


Premium


Premium


Premium


Premium


Premium


Premium


Premium


Premium


Premium

Premium


Premium


Premium

Premium
Premium

Premium

Premium


Premium


Premium

Premium

Premium

Premium

Explore More Free Stock Images