- Home >
- Stock Photos >
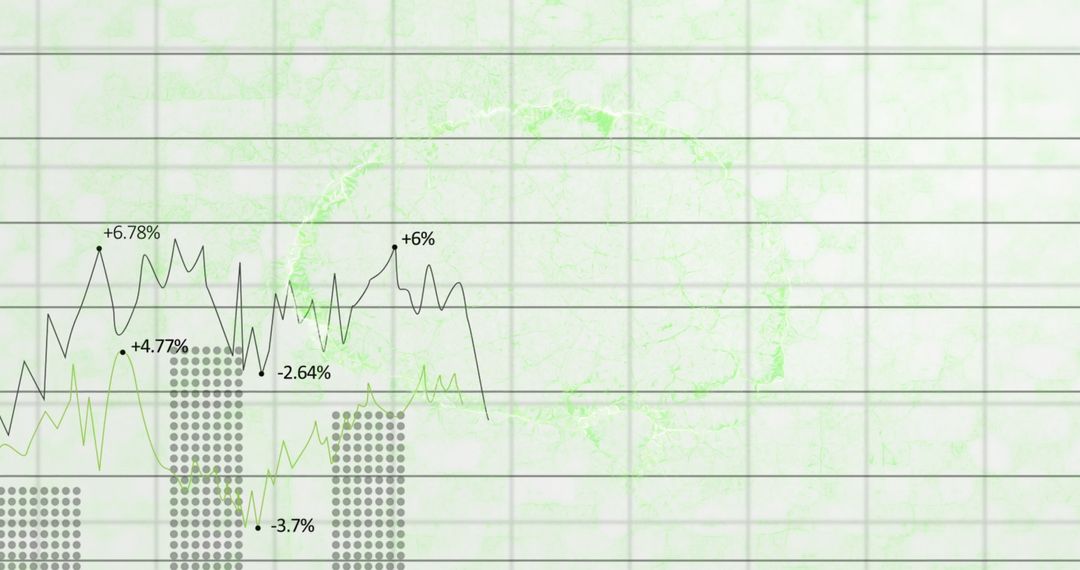
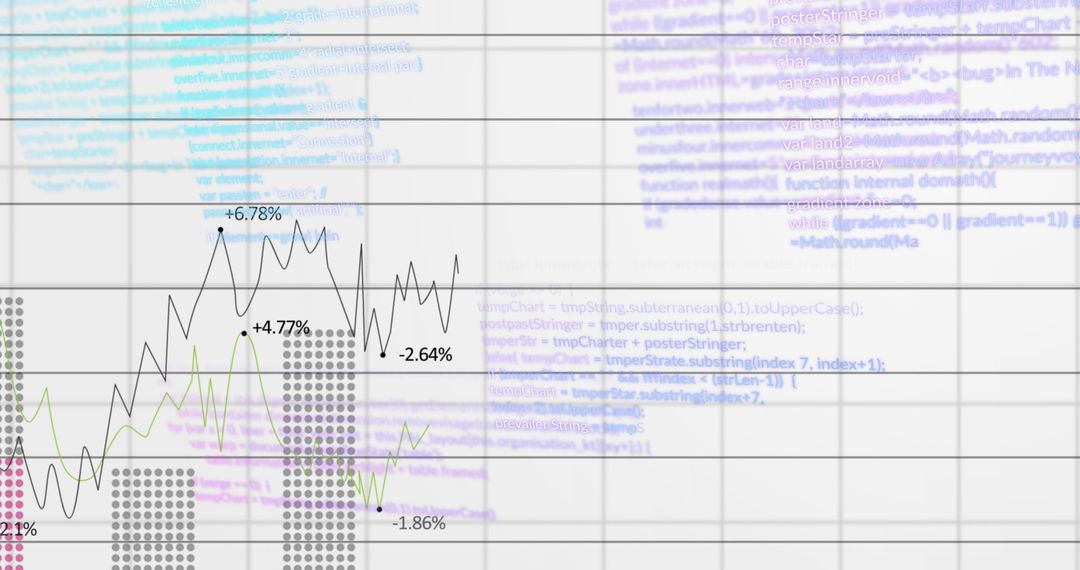
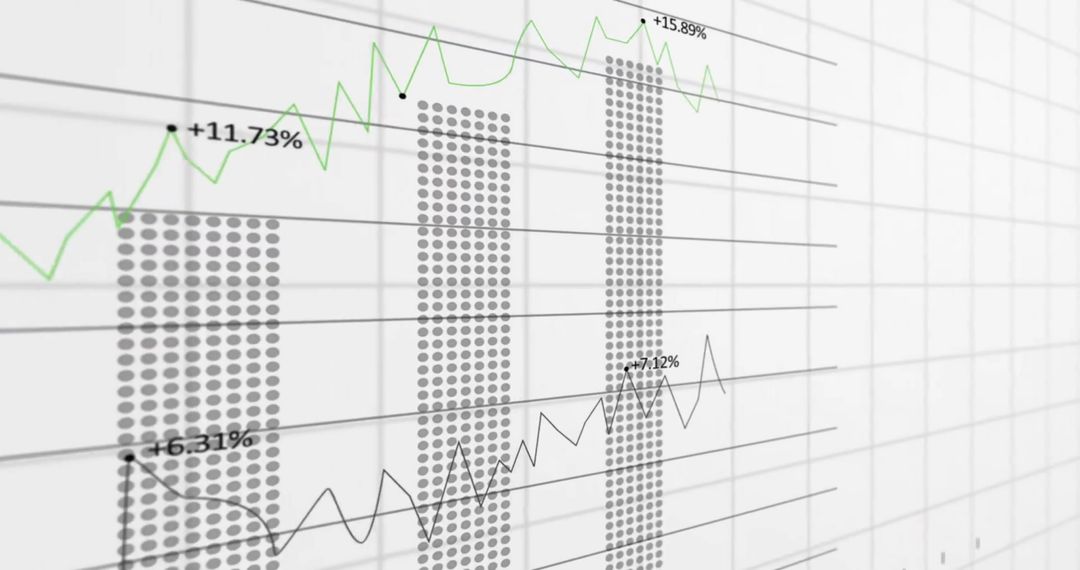
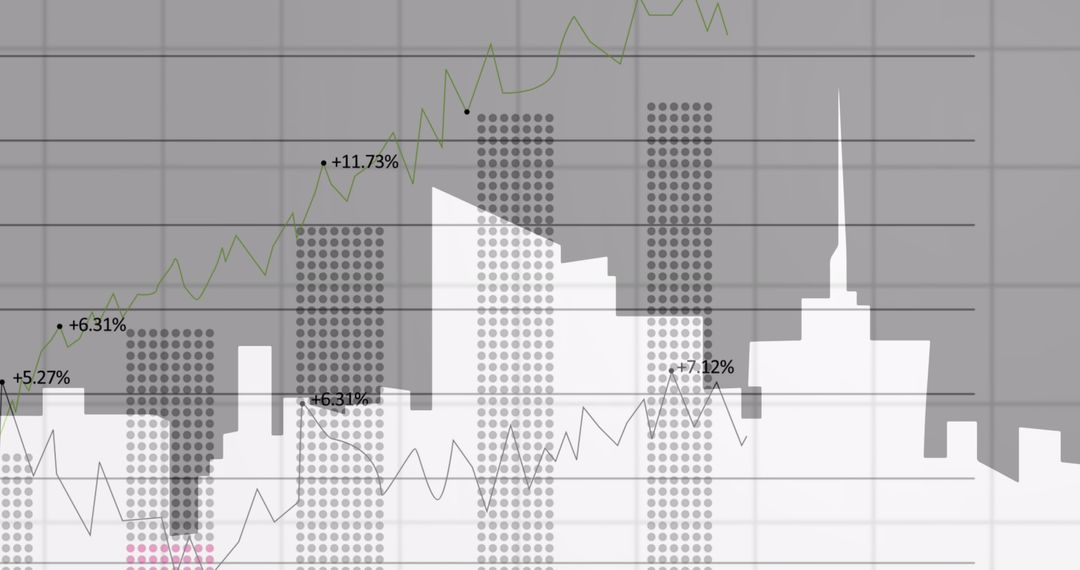
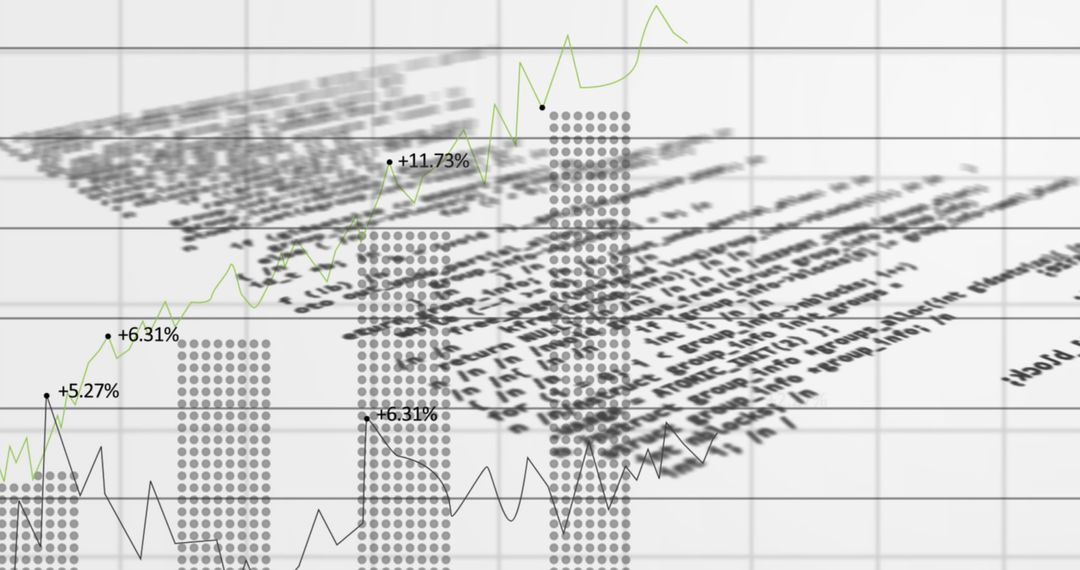
- Digital Financial Chart with Line plots and Bar Columns
Digital Financial Chart with Line plots and Bar Columns Image

This digital visual represents financial data using line plots and dotted bar columns with percentage markers. Useful for business presentations, financial reports, or investment demonstratives focusing on analytics and progress tracking.
Powered by  - Get 15% off with code: PIKWIZARD15


0
downloads
downloads
Tags:
More
Credit Photo
If you would like to credit the Photo, here are some ways you can do so
Text Link
photo Link
<span class="text-link">
<span>
<a target="_blank" href=https://pikwizard.com/photo/digital-financial-chart-with-line-plots-and-bar-columns/ca6891132b96dbbfed11a0b96a6912fa/>PikWizard</a>
</span>
</span>
<span class="image-link">
<span
style="margin: 0 0 20px 0; display: inline-block; vertical-align: middle; width: 100%;"
>
<a
target="_blank"
href="https://pikwizard.com/photo/digital-financial-chart-with-line-plots-and-bar-columns/ca6891132b96dbbfed11a0b96a6912fa/"
style="text-decoration: none; font-size: 10px; margin: 0;"
>
<img src="https://pikwizard.com/pw/medium/ca6891132b96dbbfed11a0b96a6912fa.jpg" style="margin: 0; width: 100%;" alt="" />
<p style="font-size: 12px; margin: 0;">PikWizard</p>
</a>
</span>
</span>
Free (free of charge)
Free for personal and commercial use.
Author: Awesome Content
Similar Free Stock Images

Premium