
- Home >
- Stock Photos >
- Digital Financial Chart with Mathematical Annotations
Digital Financial Chart with Mathematical Annotations Image
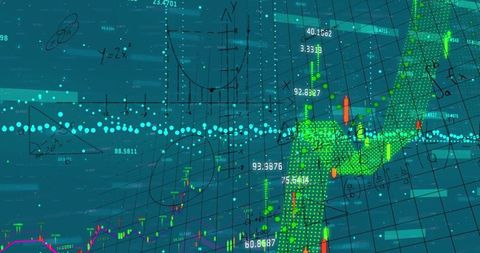
Vibrant visualization depicting a rising candlestick chart combined with digital graphs and annotations, representing financial data analysis. Perfect for use in presentations, reports, and articles related to financial markets, technology in finances, or statistical data tracking.
Powered by 


downloads
Tags:
More
Credit Photo
If you would like to credit the Photo, here are some ways you can do so
Text Link
photo Link
<span class="text-link">
<span>
<a target="_blank" href=https://pikwizard.com/photo/digital-financial-chart-with-mathematical-annotations/98f8e5e509313efe699a9dd4bd57f202/>PikWizard</a>
</span>
</span>
<span class="image-link">
<span
style="margin: 0 0 20px 0; display: inline-block; vertical-align: middle; width: 100%;"
>
<a
target="_blank"
href="https://pikwizard.com/photo/digital-financial-chart-with-mathematical-annotations/98f8e5e509313efe699a9dd4bd57f202/"
style="text-decoration: none; font-size: 10px; margin: 0;"
>
<img src="https://pikwizard.com/pw/medium/98f8e5e509313efe699a9dd4bd57f202.jpg" style="margin: 0; width: 100%;" alt="" />
<p style="font-size: 12px; margin: 0;">PikWizard</p>
</a>
</span>
</span>
Free (free of charge)
Free for personal and commercial use.
Author: Authentic Images