- Home >
- Stock Photos >
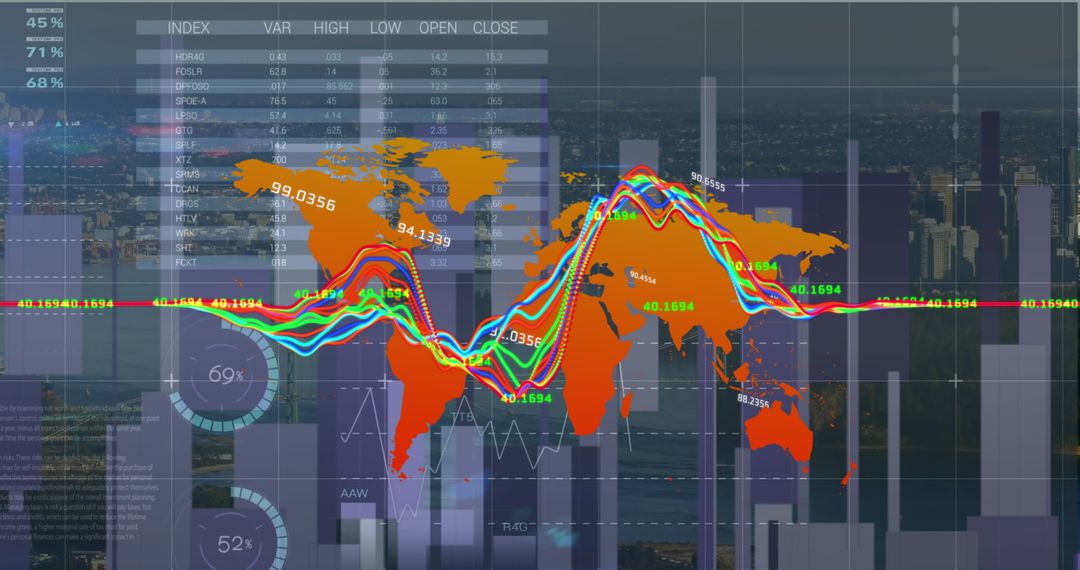
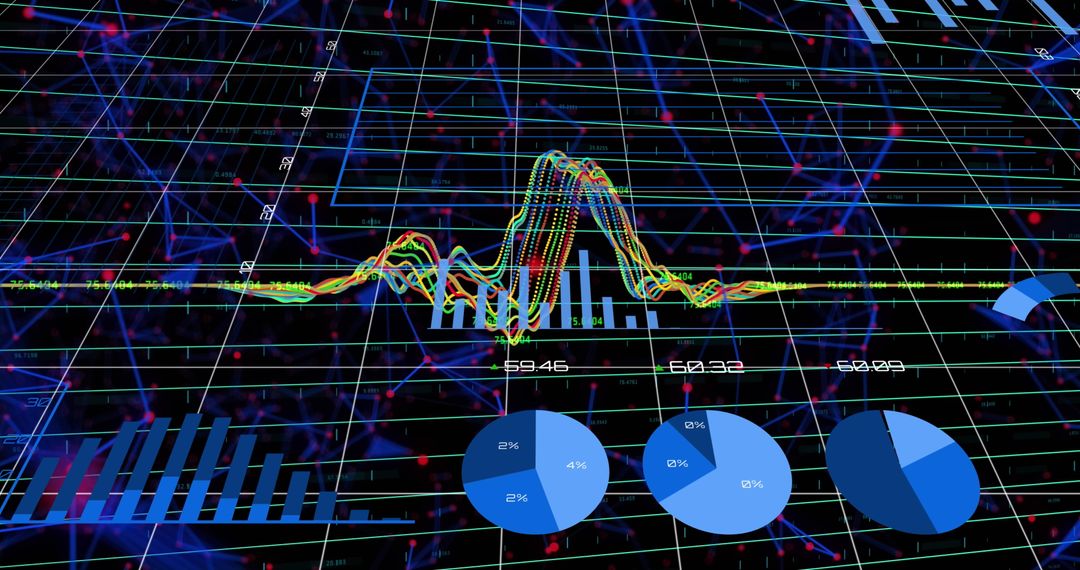
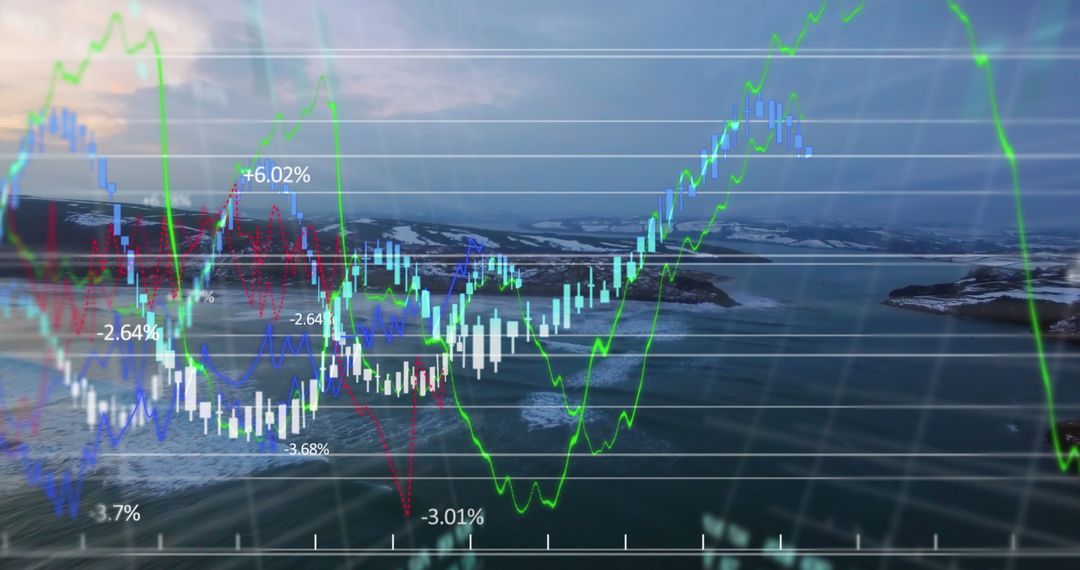
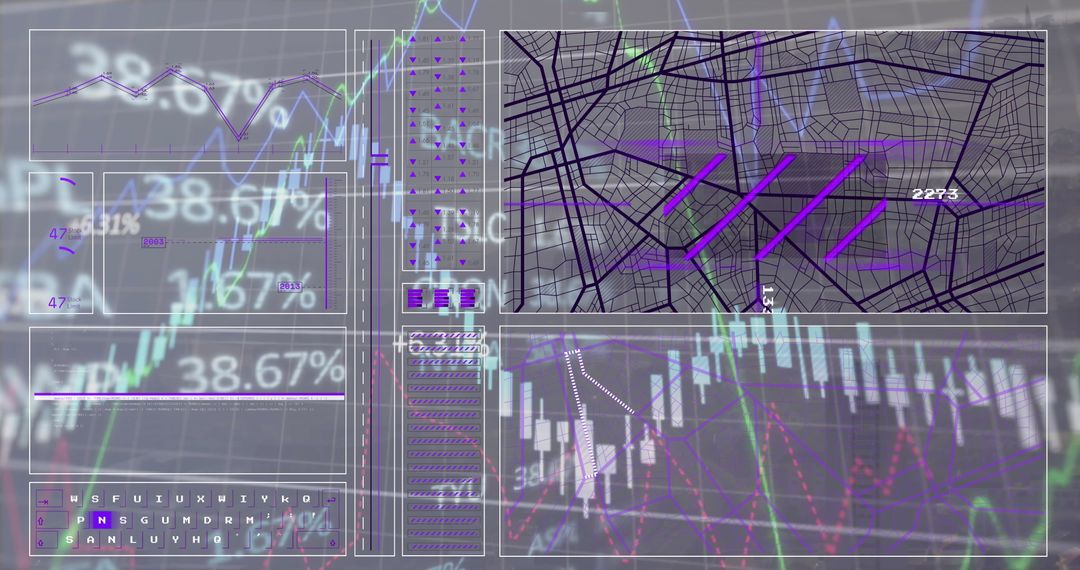
- Digital Financial Chart with Stock Market Data and Analytics
Digital Financial Chart with Stock Market Data and Analytics Image

Visualizing complexity of financial markets with digital charts and analytics. Showing stock market activity with colorful graphs and numerical data on dark futuristic background. Ideal for illustrating concepts in finance, stock trading, economic analysis, and digital economy strategy.
Powered by 


2
downloads
downloads
Tags:
More
Credit Photo
If you would like to credit the Photo, here are some ways you can do so
Text Link
photo Link
<span class="text-link">
<span>
<a target="_blank" href=https://pikwizard.com/photo/digital-financial-chart-with-stock-market-data-and-analytics/986beb791cb360cab983a3d42793b58a/>PikWizard</a>
</span>
</span>
<span class="image-link">
<span
style="margin: 0 0 20px 0; display: inline-block; vertical-align: middle; width: 100%;"
>
<a
target="_blank"
href="https://pikwizard.com/photo/digital-financial-chart-with-stock-market-data-and-analytics/986beb791cb360cab983a3d42793b58a/"
style="text-decoration: none; font-size: 10px; margin: 0;"
>
<img src="https://pikwizard.com/pw/medium/986beb791cb360cab983a3d42793b58a.jpg" style="margin: 0; width: 100%;" alt="" />
<p style="font-size: 12px; margin: 0;">PikWizard</p>
</a>
</span>
</span>
Free (free of charge)
Free for personal and commercial use.
Author: Authentic Images
Similar Free Stock Images

Premium


Premium


Premium


Premium


Premium


Premium


Premium


Premium


Premium


Premium


Premium


Premium


Premium


Premium


Premium


Premium


Premium


Premium


Premium


Premium


Premium


Premium


Premium


Premium