- Home >
- Stock Photos >
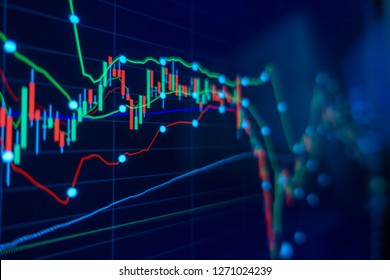
- Digital Financial Chart With Trend Lines and Analytics Display
Digital Financial Chart With Trend Lines and Analytics Display Image

Displaying a digital finance chart complete with candlestick patterns, highlighted trend lines, and percentage markers across the graph. This visual representation offers insights into financial markets, showcasing data trends through a modern digital interface, useful for presentations, financial reports, and educational materials focusing on stock market analysis and investment strategies.
Powered by  - Get 15% off with code: PIKWIZARD15


0
downloads
downloads
Tags:
More
Credit Photo
If you would like to credit the Photo, here are some ways you can do so
Text Link
photo Link
<span class="text-link">
<span>
<a target="_blank" href=https://pikwizard.com/photo/digital-financial-chart-with-trend-lines-and-analytics-display/3fc368d527b6d24251f79b2d1d758aac/>PikWizard</a>
</span>
</span>
<span class="image-link">
<span
style="margin: 0 0 20px 0; display: inline-block; vertical-align: middle; width: 100%;"
>
<a
target="_blank"
href="https://pikwizard.com/photo/digital-financial-chart-with-trend-lines-and-analytics-display/3fc368d527b6d24251f79b2d1d758aac/"
style="text-decoration: none; font-size: 10px; margin: 0;"
>
<img src="https://pikwizard.com/pw/medium/3fc368d527b6d24251f79b2d1d758aac.jpg" style="margin: 0; width: 100%;" alt="" />
<p style="font-size: 12px; margin: 0;">PikWizard</p>
</a>
</span>
</span>
Free (free of charge)
Free for personal and commercial use.
Author: People Creations
Similar Free Stock Images

Premium


Premium


Premium


Premium


Premium


Premium


Premium


Premium


Premium


Premium


Premium


Premium


Premium


Premium


Premium


Premium


Premium


Premium


Premium


Premium


Premium


Premium


Premium


Premium