
- Home >
- Stock Photos >
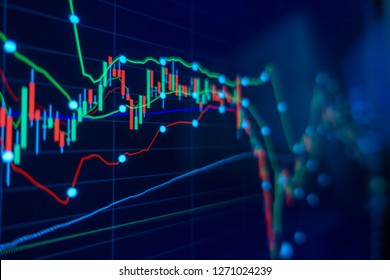
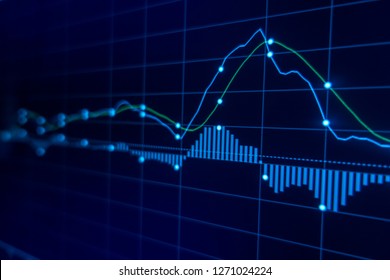
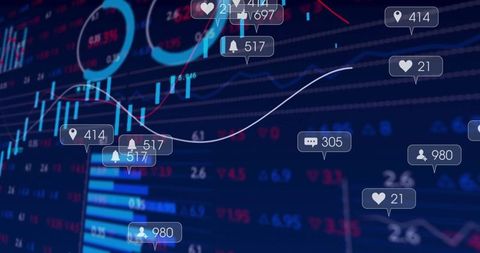
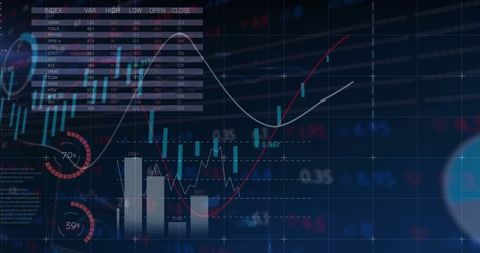
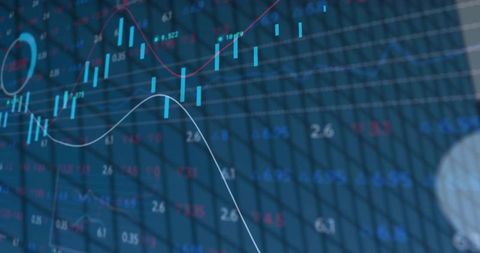
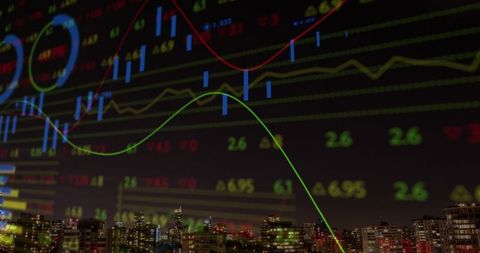
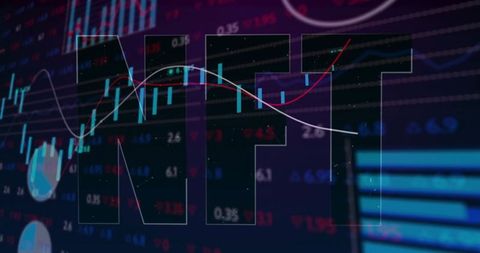
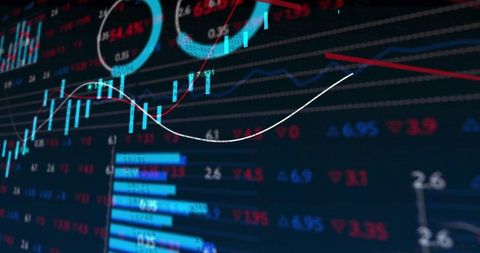
- Digital Financial Chart with Trend Lines on Trading Screen
Digital Financial Chart with Trend Lines on Trading Screen Image

Digital financial chart with blue candlesticks and white and red trend lines can be a valuable visual tool for investors and finance professionals analyzing market trends. Ideal for use in financial presentations, investment reports, or data analysis materials, it effectively conveys trade insights and financial movements. Suitable for illustrating market activity or for use in educational contexts regarding stock analysis and technology integration in modern trading.
Powered by  - Get 15% off with code: PIKWIZARD15


0
downloads
downloads
Tags:
More
Credit Photo
If you would like to credit the Photo, here are some ways you can do so
Text Link
photo Link
<span class="text-link">
<span>
<a target="_blank" href=https://pikwizard.com/photo/digital-financial-chart-with-trend-lines-on-trading-screen/2f58b78aed71234d805afd9319368a96/>PikWizard</a>
</span>
</span>
<span class="image-link">
<span
style="margin: 0 0 20px 0; display: inline-block; vertical-align: middle; width: 100%;"
>
<a
target="_blank"
href="https://pikwizard.com/photo/digital-financial-chart-with-trend-lines-on-trading-screen/2f58b78aed71234d805afd9319368a96/"
style="text-decoration: none; font-size: 10px; margin: 0;"
>
<img src="https://pikwizard.com/pw/medium/2f58b78aed71234d805afd9319368a96.jpg" style="margin: 0; width: 100%;" alt="" />
<p style="font-size: 12px; margin: 0;">PikWizard</p>
</a>
</span>
</span>
Free (free of charge)
Free for personal and commercial use.
Author: Authentic Images
Similar Free Stock Images

Premium


Premium


Premium


Premium


Premium


Premium


Premium


Premium


Premium


Premium


Premium


Premium


Premium


Premium


Premium


Premium


Premium


Premium


Premium


Premium


Premium


Premium


Premium


Premium


Premium

