- Home >
- Stock Photos >
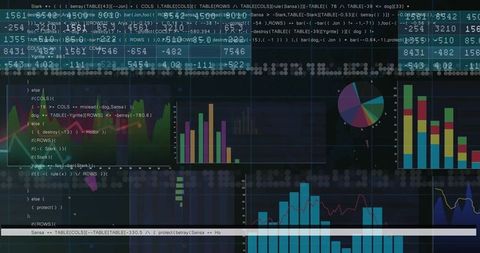
- Digital Financial Charting and Data Processing on Black Background
Digital Financial Charting and Data Processing on Black Background Image

This image depicts various bar graphs, line charts, and pie charts symbolizing financial data processing against a black background. The combination of digital elements makes it ideal for illustrating global business strategies and data-driven decision making. It can be used in presentations, reports, or websites relating to finance and technology sectors, facilitating a modern and tech-savvy impression.

downloads
Tags:
More
Credit Photo
If you would like to credit the Photo, here are some ways you can do so
Text Link
photo Link
<span class="text-link">
<span>
<a target="_blank" href=https://pikwizard.com/photo/digital-financial-charting-and-data-processing-on-black-background/b128de886143667124de7d3505a87417/>PikWizard</a>
</span>
</span>
<span class="image-link">
<span
style="margin: 0 0 20px 0; display: inline-block; vertical-align: middle; width: 100%;"
>
<a
target="_blank"
href="https://pikwizard.com/photo/digital-financial-charting-and-data-processing-on-black-background/b128de886143667124de7d3505a87417/"
style="text-decoration: none; font-size: 10px; margin: 0;"
>
<img src="https://pikwizard.com/pw/medium/b128de886143667124de7d3505a87417.jpg" style="margin: 0; width: 100%;" alt="" />
<p style="font-size: 12px; margin: 0;">PikWizard</p>
</a>
</span>
</span>
Free (free of charge)
Free for personal and commercial use.
Author: Creative Art