- Home >
- Stock Photos >
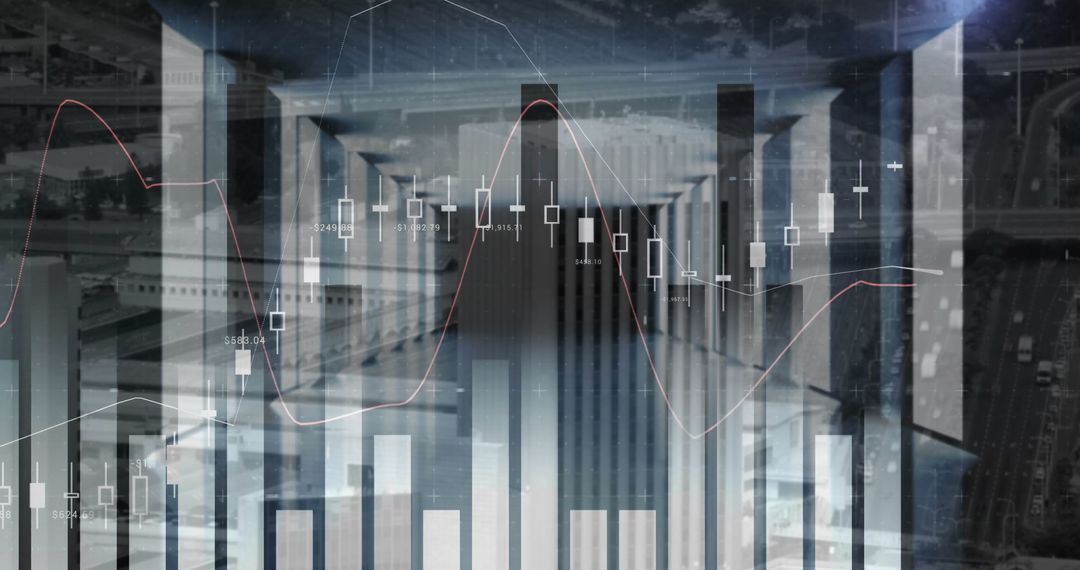
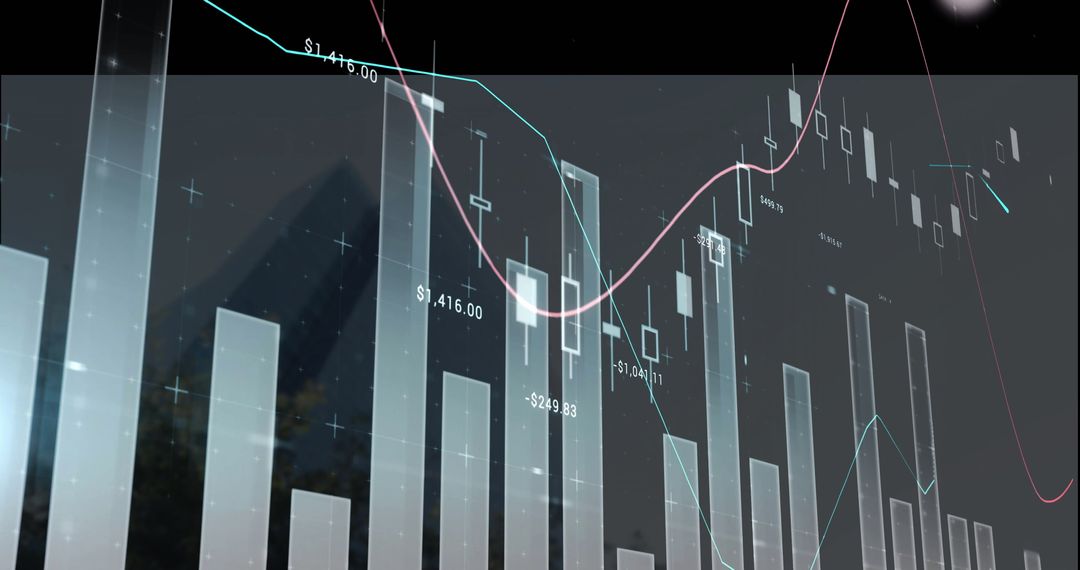
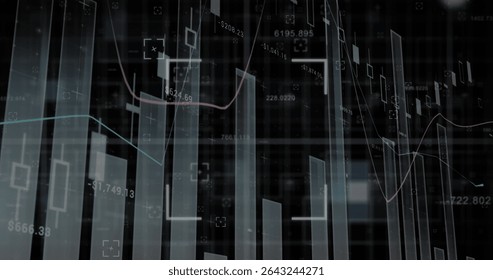
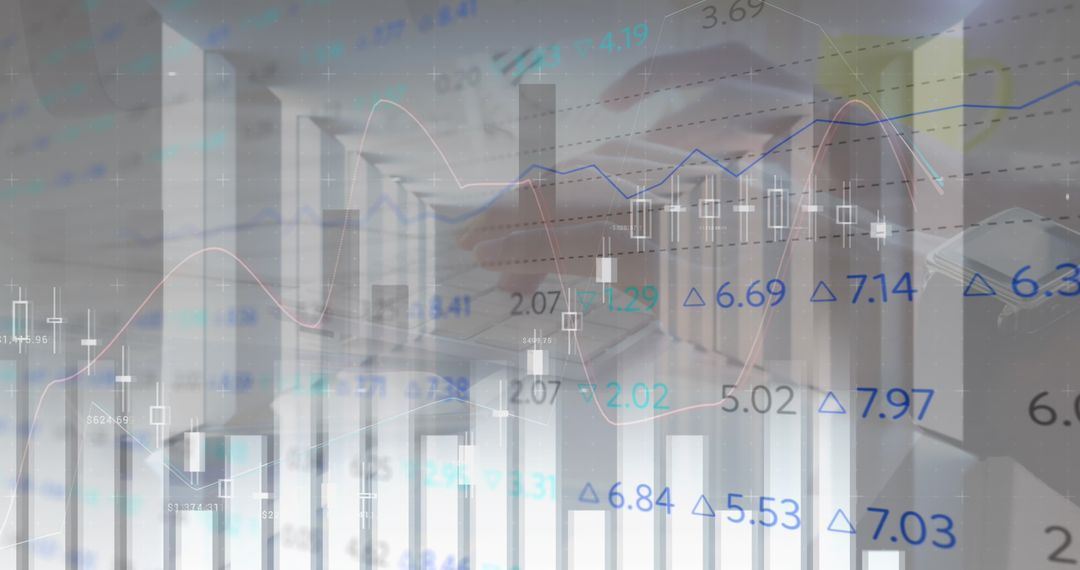
- Digital Financial Charts and Graphs with Overlay
Digital Financial Charts and Graphs with Overlay Image

Graphical representation of fiscal trends, with components like bar charts, candlesticks, and line graphs. Often used by analysts and investors to interpret market behaviors. Useful for illustrating themes of finance, business analytics, financial technology tools, and data-driven decision making in presentations or articles about economic trends.
Powered by  - Get 15% off with code: PIKWIZARD15


2
downloads
downloads
Tags:
More
Credit Photo
If you would like to credit the Photo, here are some ways you can do so
Text Link
photo Link
<span class="text-link">
<span>
<a target="_blank" href=https://pikwizard.com/photo/digital-financial-charts-and-graphs-with-overlay/93012acc75816b29da65d1a14fbe67ae/>PikWizard</a>
</span>
</span>
<span class="image-link">
<span
style="margin: 0 0 20px 0; display: inline-block; vertical-align: middle; width: 100%;"
>
<a
target="_blank"
href="https://pikwizard.com/photo/digital-financial-charts-and-graphs-with-overlay/93012acc75816b29da65d1a14fbe67ae/"
style="text-decoration: none; font-size: 10px; margin: 0;"
>
<img src="https://pikwizard.com/pw/medium/93012acc75816b29da65d1a14fbe67ae.jpg" style="margin: 0; width: 100%;" alt="" />
<p style="font-size: 12px; margin: 0;">PikWizard</p>
</a>
</span>
</span>
Free (free of charge)
Free for personal and commercial use.
Author: Creative Art
Similar Free Stock Images

Premium


Premium


Premium


Premium


Premium


Premium


Premium


Premium


Premium


Premium


Premium


Premium


Premium


Premium


Premium


Premium


Premium


Premium


Premium


Premium


Premium


Premium


Premium


Premium