- Home >
- Stock Photos >
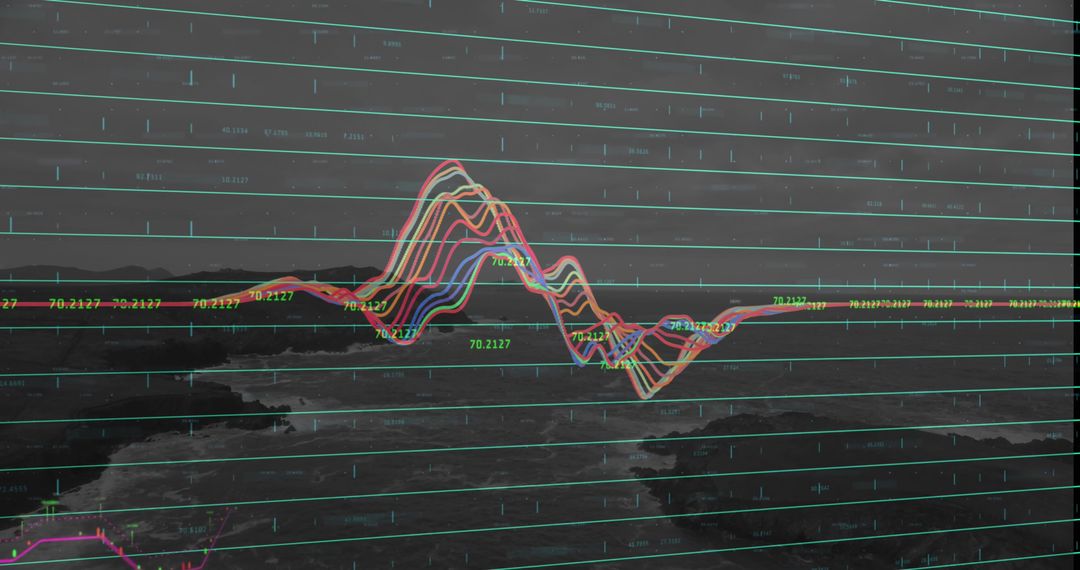
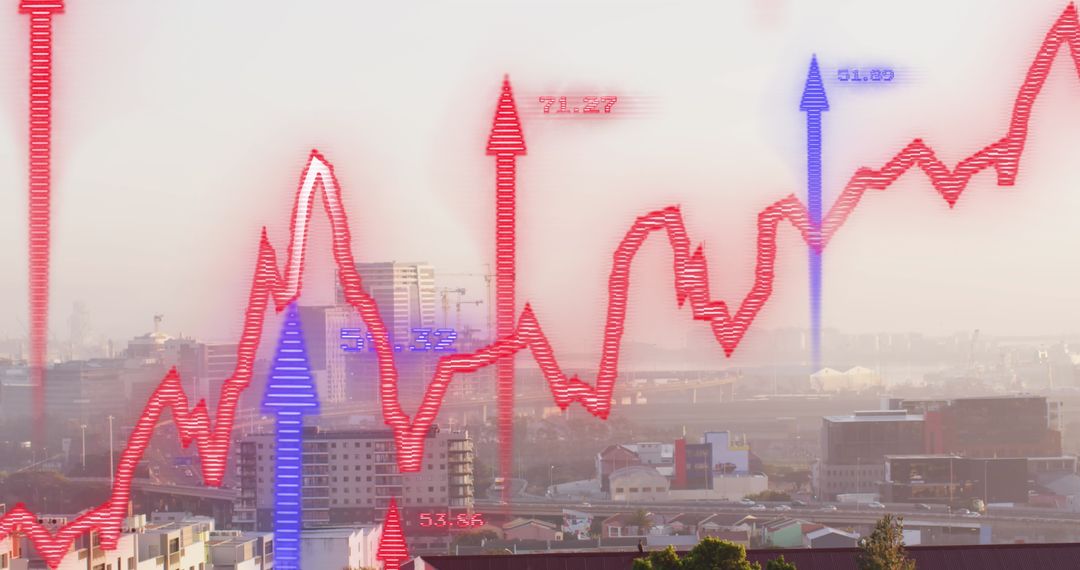
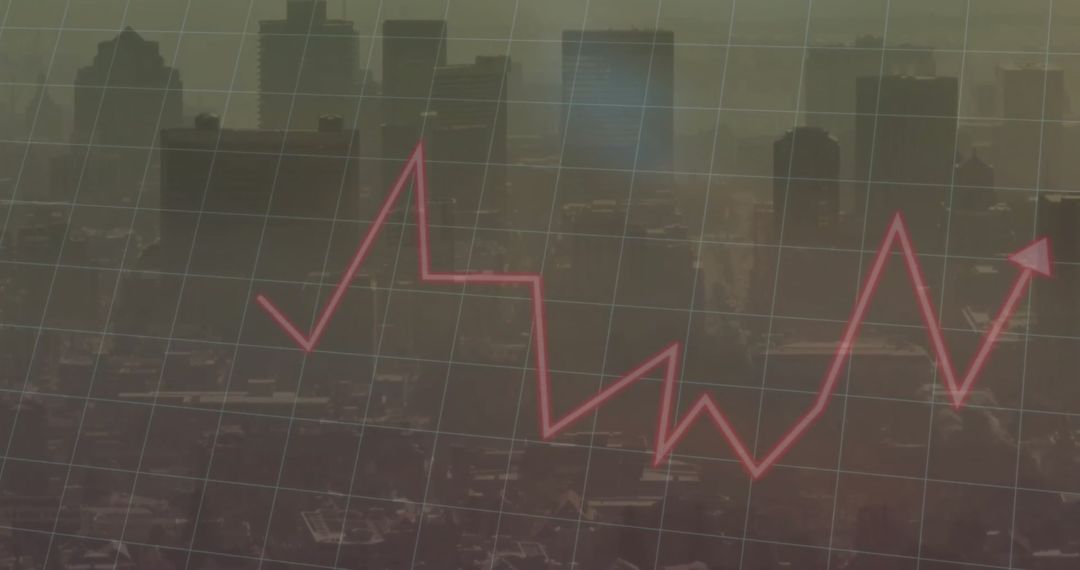
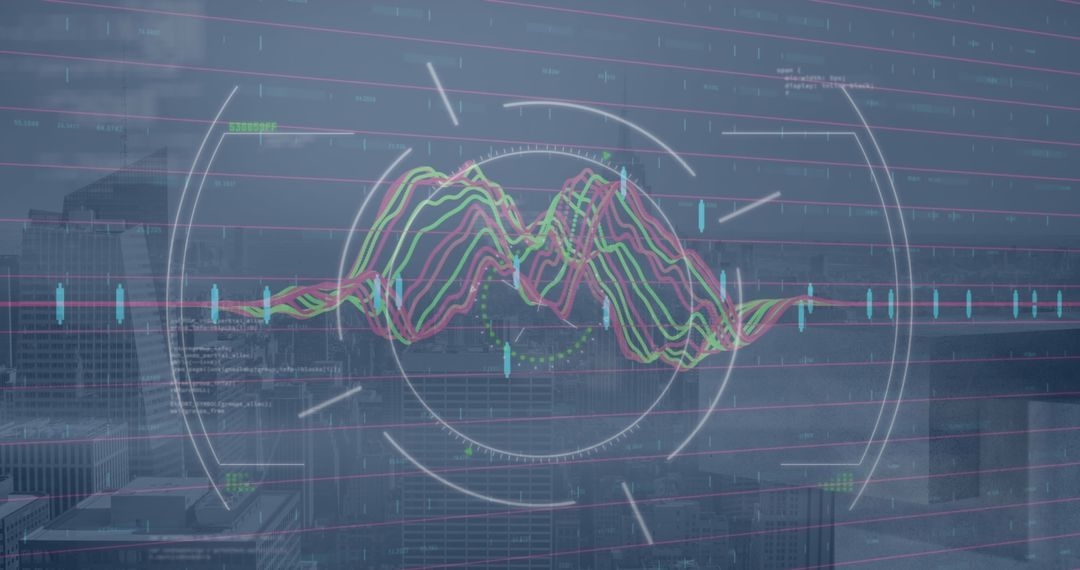
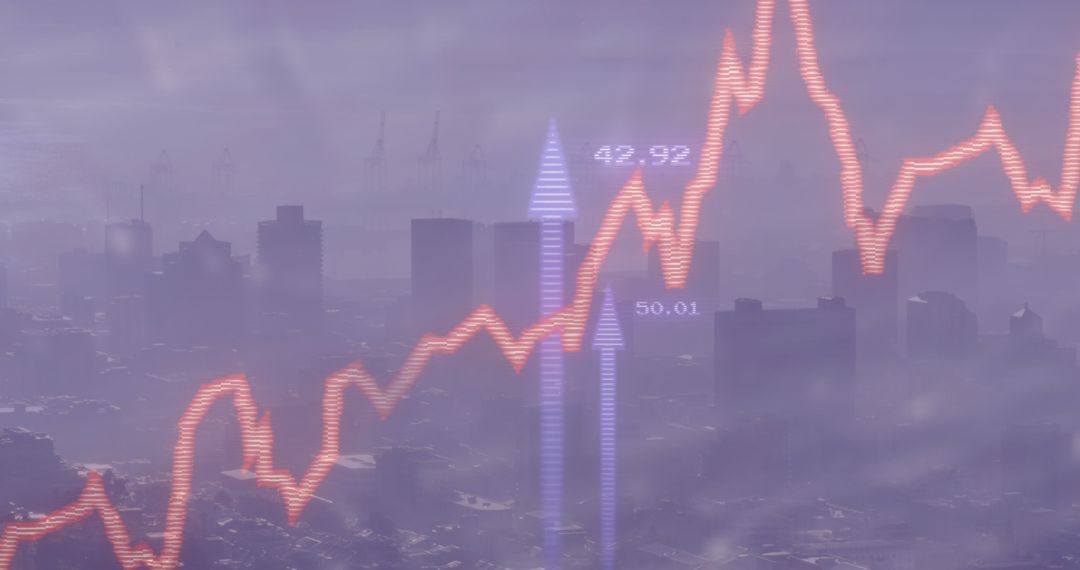
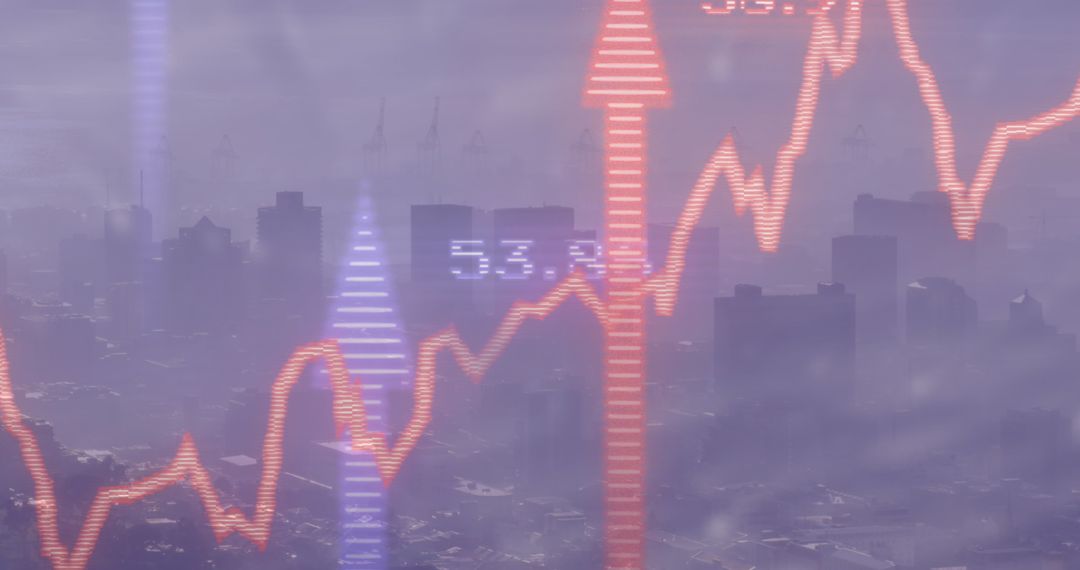
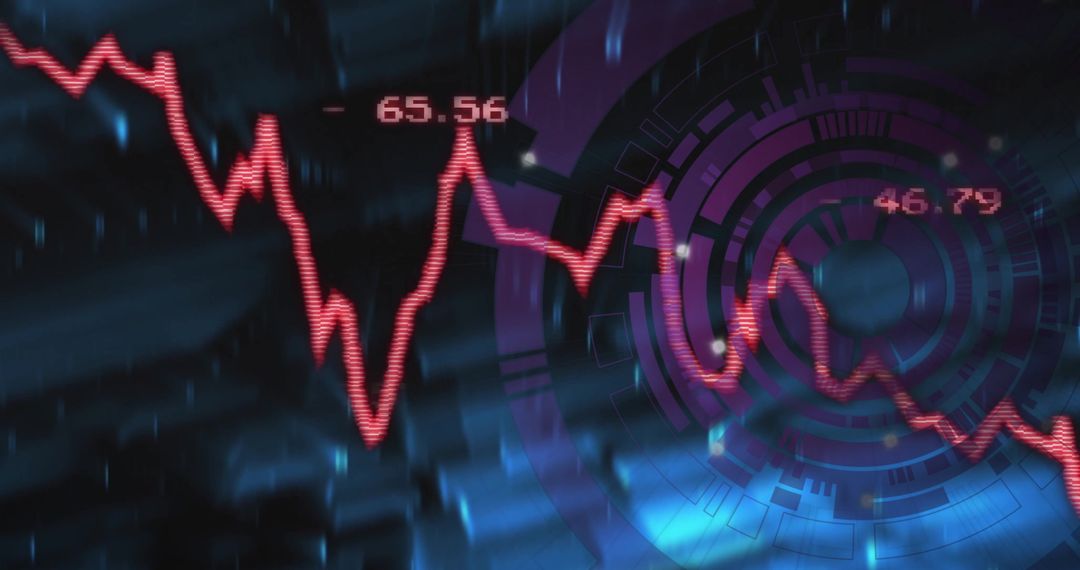
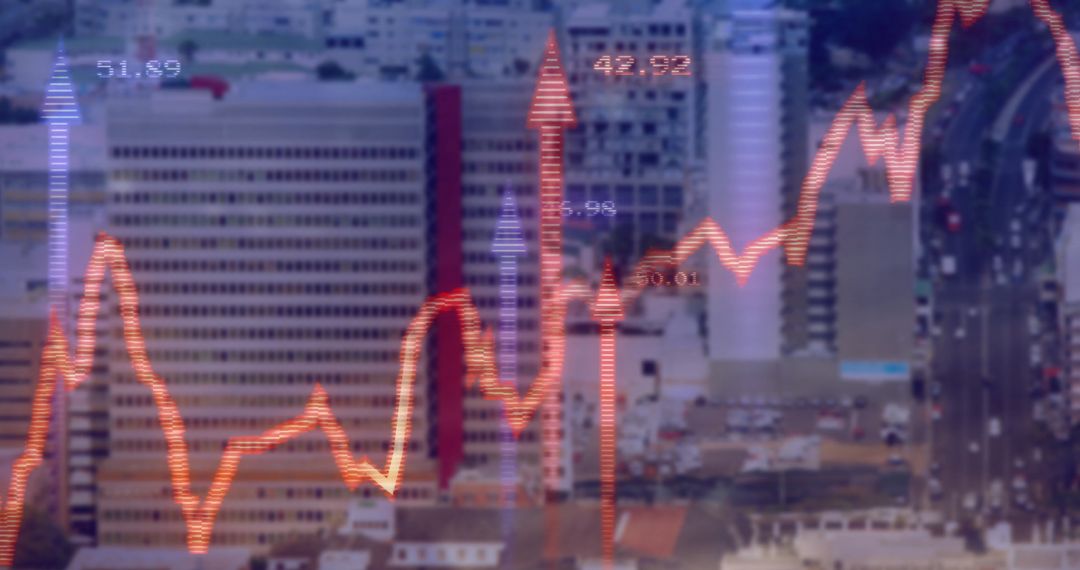
- Digital Financial Charts and Market Analysis with Data Streams on Purple
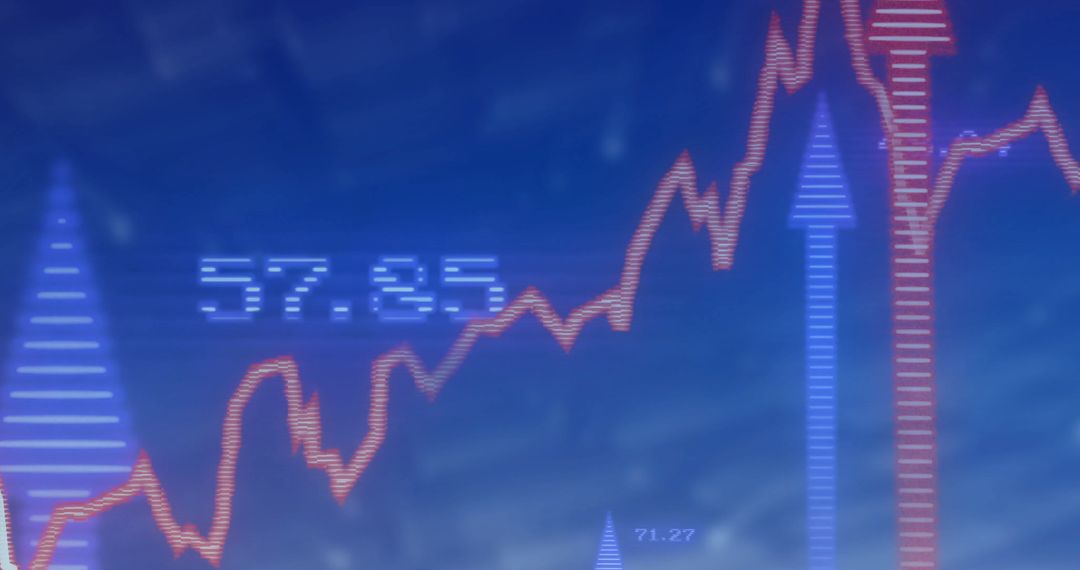
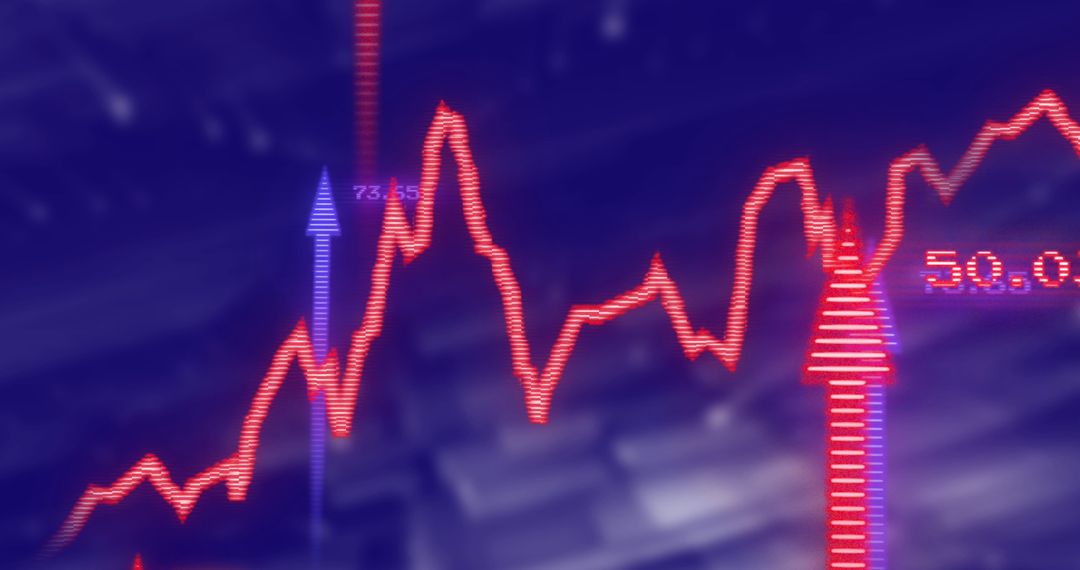
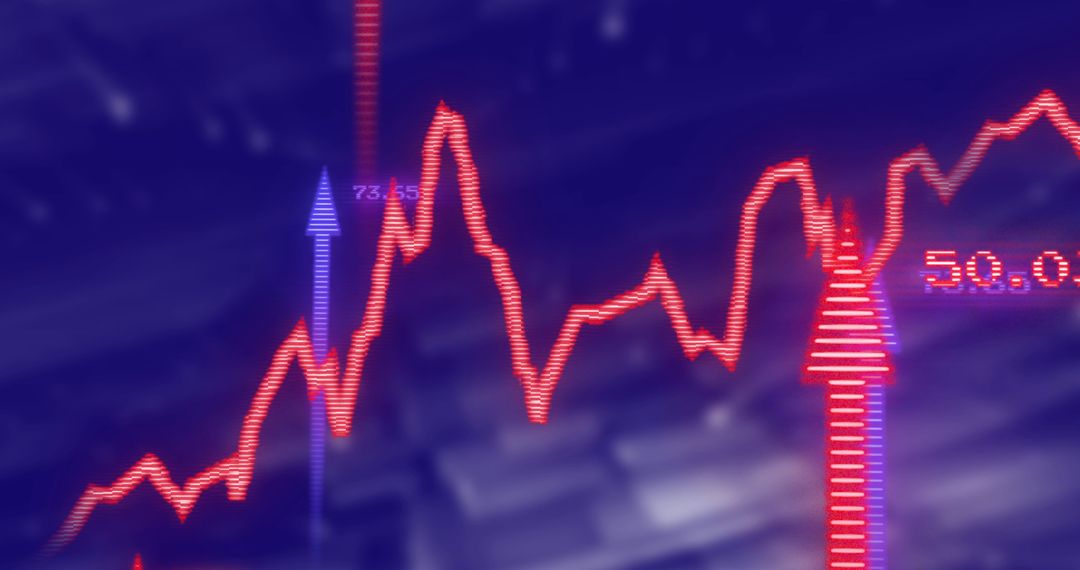
Digital Financial Charts and Market Analysis with Data Streams on Purple Image

Dynamic portrayal of digital financial charts and data streams over a contrasting purple background. Red arrows indicate economic trends and movements, making it an ideal representation of stock market activity and global finance insights. Represents concepts like investment, data analysis, and economic forecasting, making it highly suitable for business presentations, finance-related articles, and technological reports.
Powered by  - Get 15% off with code: PIKWIZARD15


2
downloads
downloads
Tags:
More
Credit Photo
If you would like to credit the Photo, here are some ways you can do so
Text Link
photo Link
<span class="text-link">
<span>
<a target="_blank" href=https://pikwizard.com/photo/digital-financial-charts-and-market-analysis-with-data-streams-on-purple/28f6dd30c371b9d550fff1d70c90259e/>PikWizard</a>
</span>
</span>
<span class="image-link">
<span
style="margin: 0 0 20px 0; display: inline-block; vertical-align: middle; width: 100%;"
>
<a
target="_blank"
href="https://pikwizard.com/photo/digital-financial-charts-and-market-analysis-with-data-streams-on-purple/28f6dd30c371b9d550fff1d70c90259e/"
style="text-decoration: none; font-size: 10px; margin: 0;"
>
<img src="https://pikwizard.com/pw/medium/28f6dd30c371b9d550fff1d70c90259e.jpg" style="margin: 0; width: 100%;" alt="" />
<p style="font-size: 12px; margin: 0;">PikWizard</p>
</a>
</span>
</span>
Free (free of charge)
Free for personal and commercial use.
Author: Creative Art
Similar Free Stock Images

Premium


Premium


Premium


Premium


Premium


Premium


Premium


Premium


Premium


Premium


Premium


Premium


Premium


Premium


Premium


Premium


Premium


Premium


Premium


Premium


Premium


Premium


Premium


Premium