- Home >
- Stock Photos >
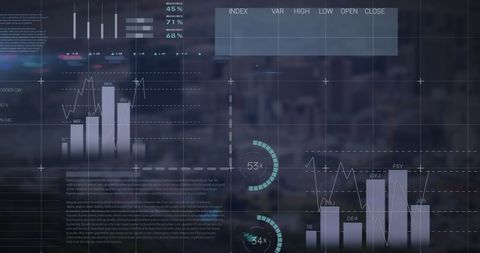
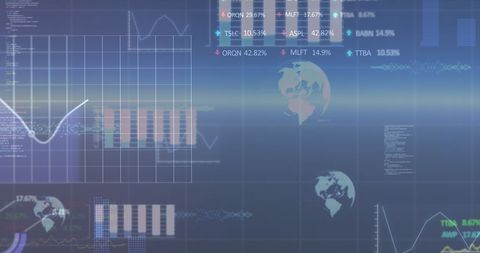
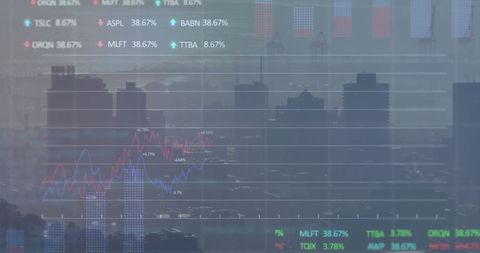
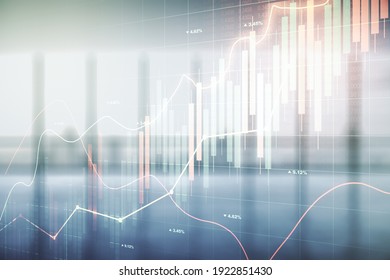
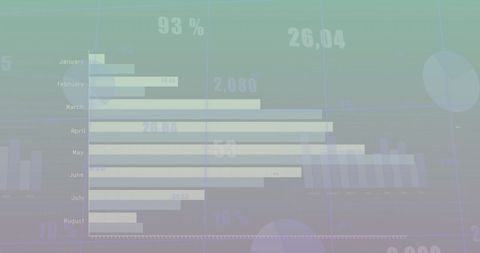
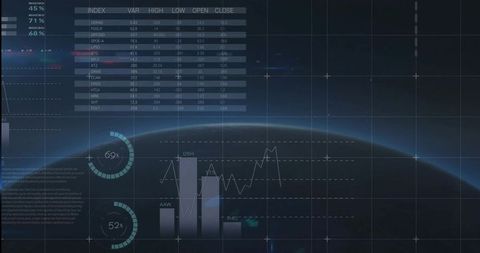
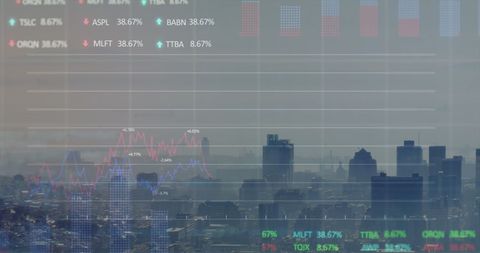
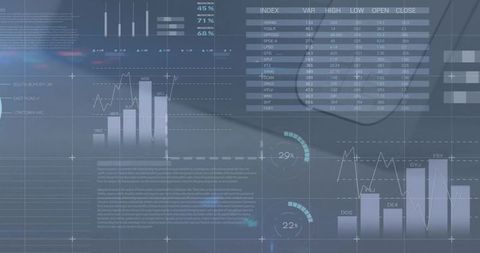
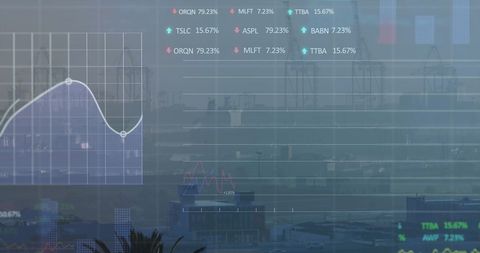
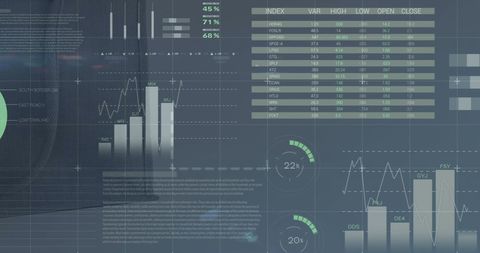
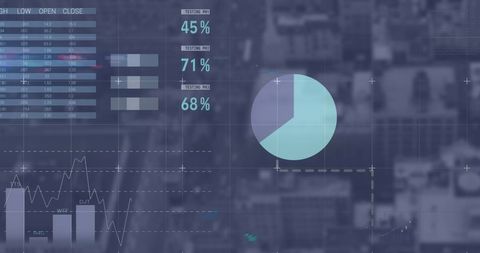
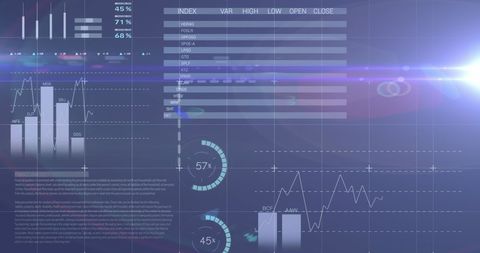
- Digital Financial Charts Displaying Market Trends and Data
Digital Financial Charts Displaying Market Trends and Data Image

Visual depicting digital financial charts featuring graphical display of market trends and statistical data, suitable for illustrating concepts related to finance, stock market analysis, data-driven decisions in business, and financial forecasting. Useful for presentations, reports, and finance-related content.
Powered by  - Get 15% off with code: PIKWIZARD15


2
downloads
downloads
Tags:
More
Credit Photo
If you would like to credit the Photo, here are some ways you can do so
Text Link
photo Link
<span class="text-link">
<span>
<a target="_blank" href=https://pikwizard.com/photo/digital-financial-charts-displaying-market-trends-and-data/5b3756349d9d33864adf9eba8881312e/>PikWizard</a>
</span>
</span>
<span class="image-link">
<span
style="margin: 0 0 20px 0; display: inline-block; vertical-align: middle; width: 100%;"
>
<a
target="_blank"
href="https://pikwizard.com/photo/digital-financial-charts-displaying-market-trends-and-data/5b3756349d9d33864adf9eba8881312e/"
style="text-decoration: none; font-size: 10px; margin: 0;"
>
<img src="https://pikwizard.com/pw/medium/5b3756349d9d33864adf9eba8881312e.jpg" style="margin: 0; width: 100%;" alt="" />
<p style="font-size: 12px; margin: 0;">PikWizard</p>
</a>
</span>
</span>
Free (free of charge)
Free for personal and commercial use.
Author: People Creations
Similar Free Stock Images
Loading...

Premium


Premium

Premium


Premium


Premium
Premium

Premium

Premium


Premium


Premium

Premium


Premium

Premium


Premium


Premium


Premium

Premium


Premium


Premium


Premium


Premium

Premium

Premium

Premium


Premium