
- Home >
- Stock Photos >
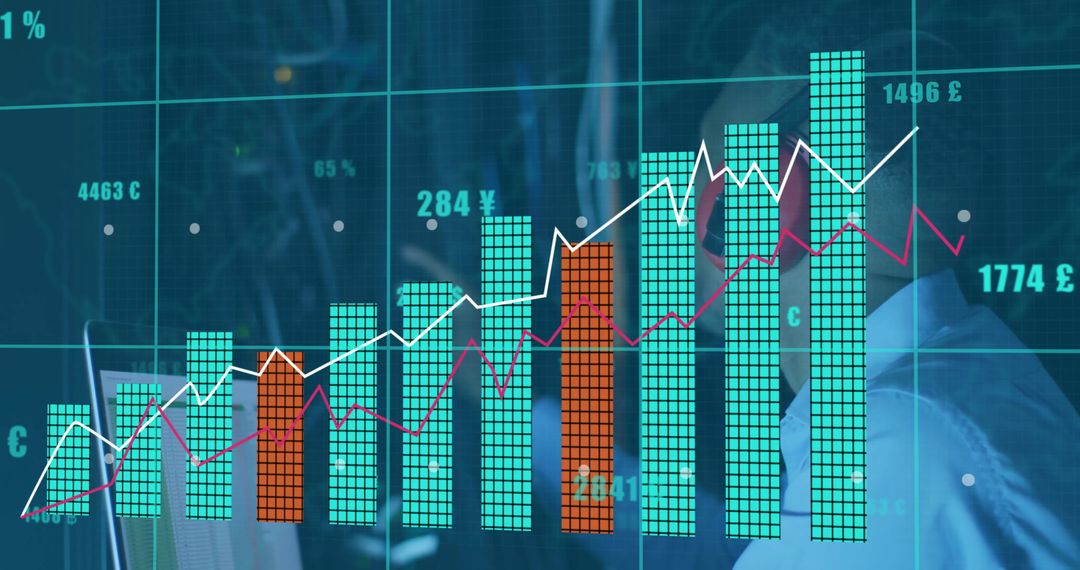
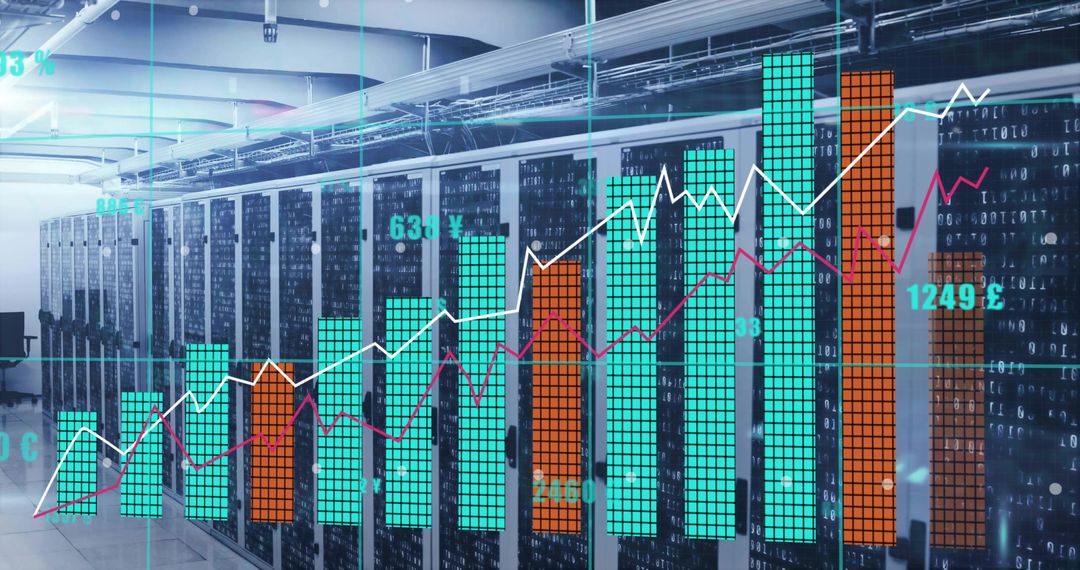
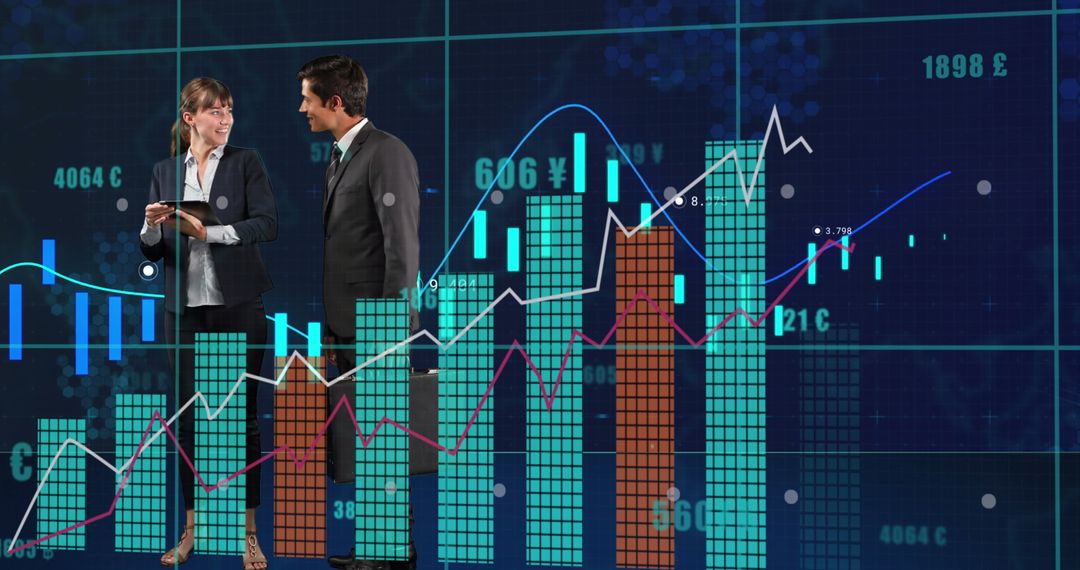
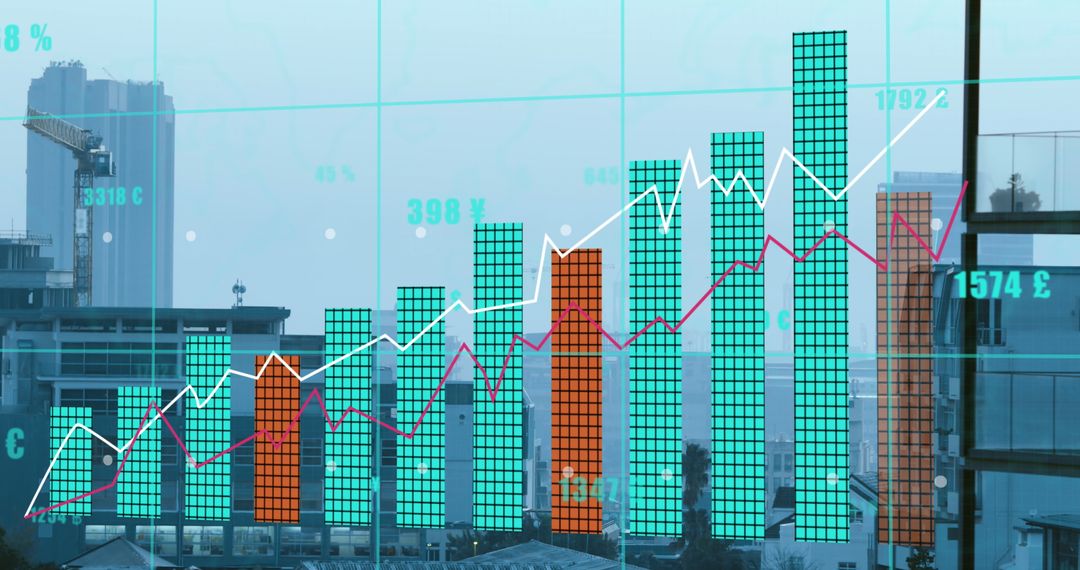
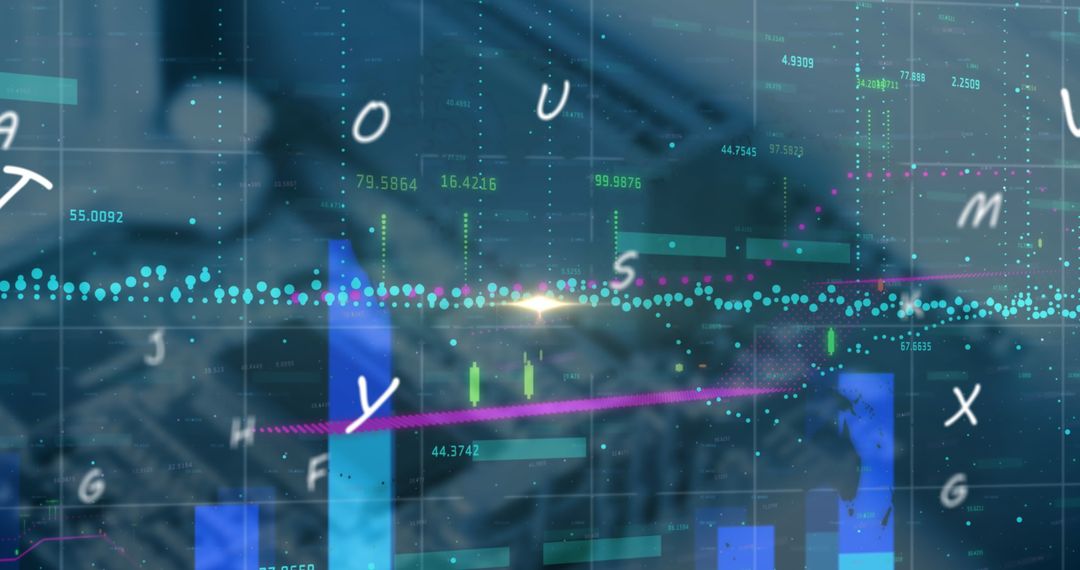
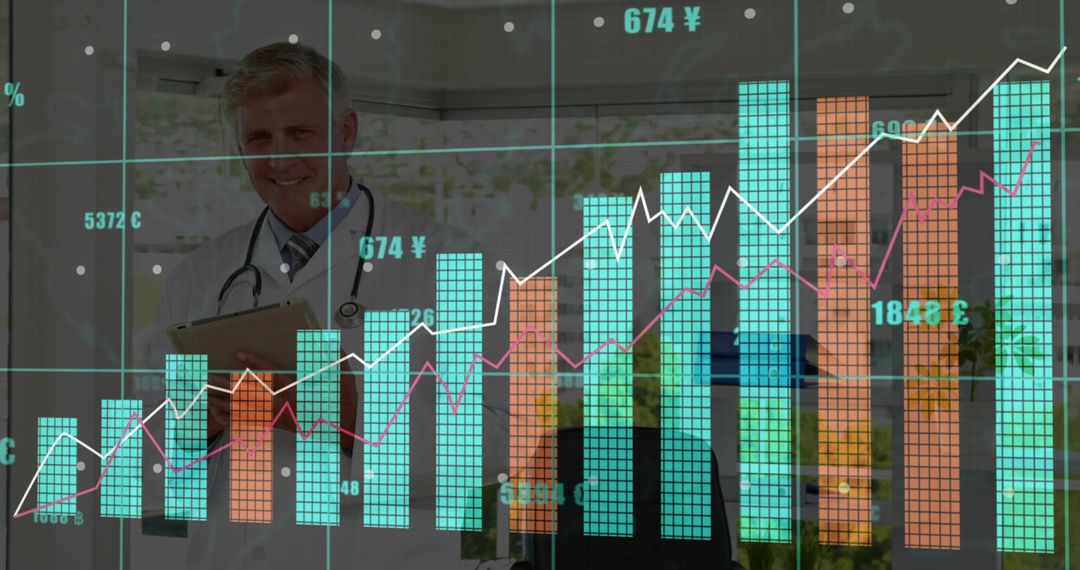
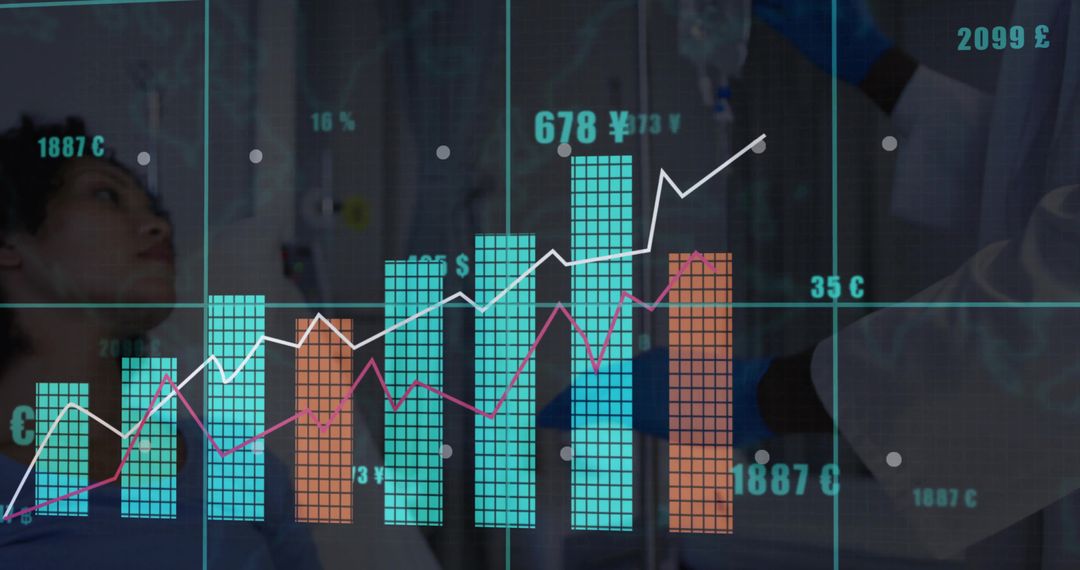
- Digital Financial Dashboard Showing Possitive Market Analytics Trends
Digital Financial Dashboard Showing Possitive Market Analytics Trends Image

This image illustrates a digital dashboard with various financial metrics and market growth indicators. The visual presentation includes teal and orange bars, line graphs, and background of absorption-like streaming green data, signifying data analysis and smart financial forecasting. Ideal for articles involving technological innovation in finance, data-driven investing strategies, or businesses focusing on enhancing their financial modeling techniques.
Powered by  - Get 15% off with code: PIKWIZARD15


2
downloads
downloads
Tags:
More
Credit Photo
If you would like to credit the Photo, here are some ways you can do so
Text Link
photo Link
<span class="text-link">
<span>
<a target="_blank" href=https://pikwizard.com/photo/digital-financial-dashboard-showing-possitive-market-analytics-trends/b2ae3a725edeb7df1b2d52d3acc54dcc/>PikWizard</a>
</span>
</span>
<span class="image-link">
<span
style="margin: 0 0 20px 0; display: inline-block; vertical-align: middle; width: 100%;"
>
<a
target="_blank"
href="https://pikwizard.com/photo/digital-financial-dashboard-showing-possitive-market-analytics-trends/b2ae3a725edeb7df1b2d52d3acc54dcc/"
style="text-decoration: none; font-size: 10px; margin: 0;"
>
<img src="https://pikwizard.com/pw/medium/b2ae3a725edeb7df1b2d52d3acc54dcc.jpg" style="margin: 0; width: 100%;" alt="" />
<p style="font-size: 12px; margin: 0;">PikWizard</p>
</a>
</span>
</span>
Free (free of charge)
Free for personal and commercial use.
Author: Creative Art
Similar Free Stock Images

Premium


Premium


Premium


Premium


Premium


Premium


Premium


Premium


Premium


Premium


Premium


Premium


Premium


Premium


Premium


Premium


Premium


Premium


Premium


Premium


Premium


Premium


Premium


Premium

