
- Home >
- Stock Photos >
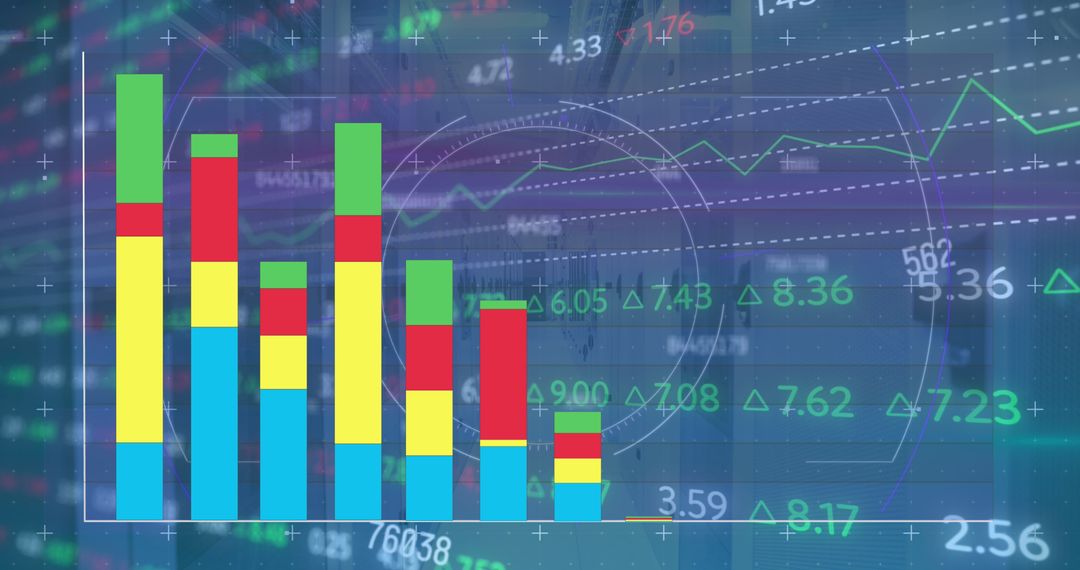
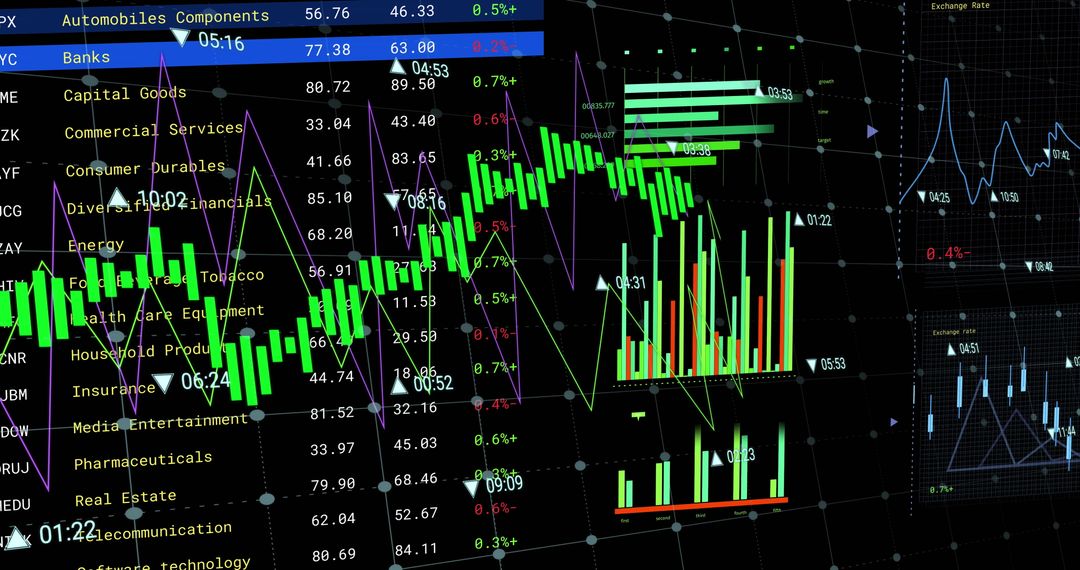
- Digital Financial Dashboard with Bar and Line Charts
Digital Financial Dashboard with Bar and Line Charts Image

Graphical representation displays multiple data types typical for financial analysis. Useful in contexts like showcasing market trends, financial technology demonstrations, data science reports or app designs focusing on trading platforms.
Powered by  - Get 15% off with code: PIKWIZARD15


0
downloads
downloads
Tags:
More
Credit Photo
If you would like to credit the Photo, here are some ways you can do so
Text Link
photo Link
<span class="text-link">
<span>
<a target="_blank" href=https://pikwizard.com/photo/digital-financial-dashboard-with-bar-and-line-charts/f33bc56b340eaba388797f2106cf21c3/>PikWizard</a>
</span>
</span>
<span class="image-link">
<span
style="margin: 0 0 20px 0; display: inline-block; vertical-align: middle; width: 100%;"
>
<a
target="_blank"
href="https://pikwizard.com/photo/digital-financial-dashboard-with-bar-and-line-charts/f33bc56b340eaba388797f2106cf21c3/"
style="text-decoration: none; font-size: 10px; margin: 0;"
>
<img src="https://pikwizard.com/pw/medium/f33bc56b340eaba388797f2106cf21c3.jpg" style="margin: 0; width: 100%;" alt="" />
<p style="font-size: 12px; margin: 0;">PikWizard</p>
</a>
</span>
</span>
Free (free of charge)
Free for personal and commercial use.
Author: Awesome Content
Similar Free Stock Images

Premium


Premium


Premium


Premium


Premium


Premium


Premium


Premium


Premium


Premium


Premium


Premium


Premium


Premium


Premium


Premium


Premium


Premium


Premium


Premium


Premium


Premium


Premium


Premium

