- Home >
- Stock Photos >
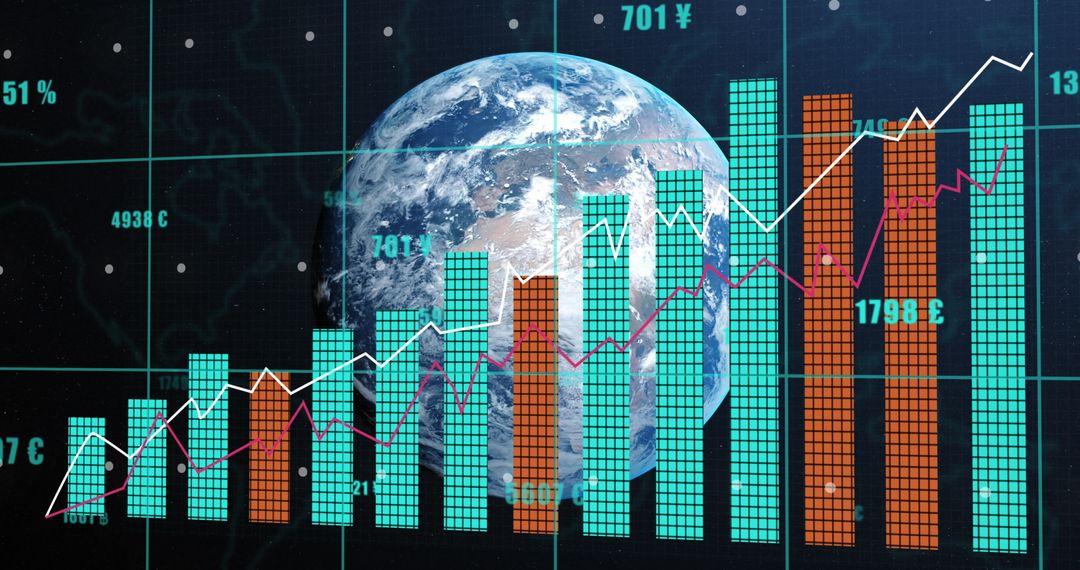
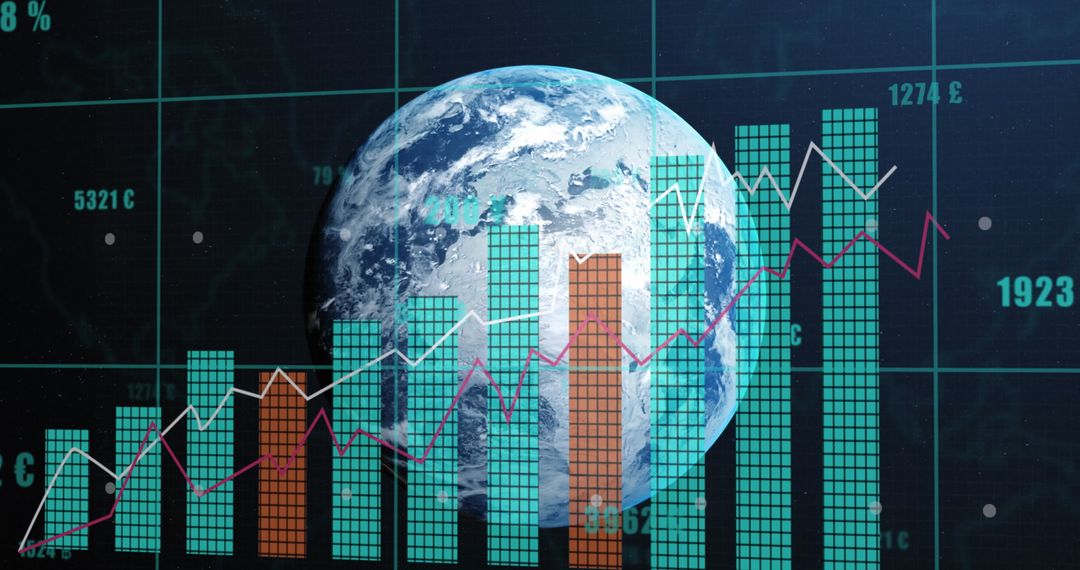
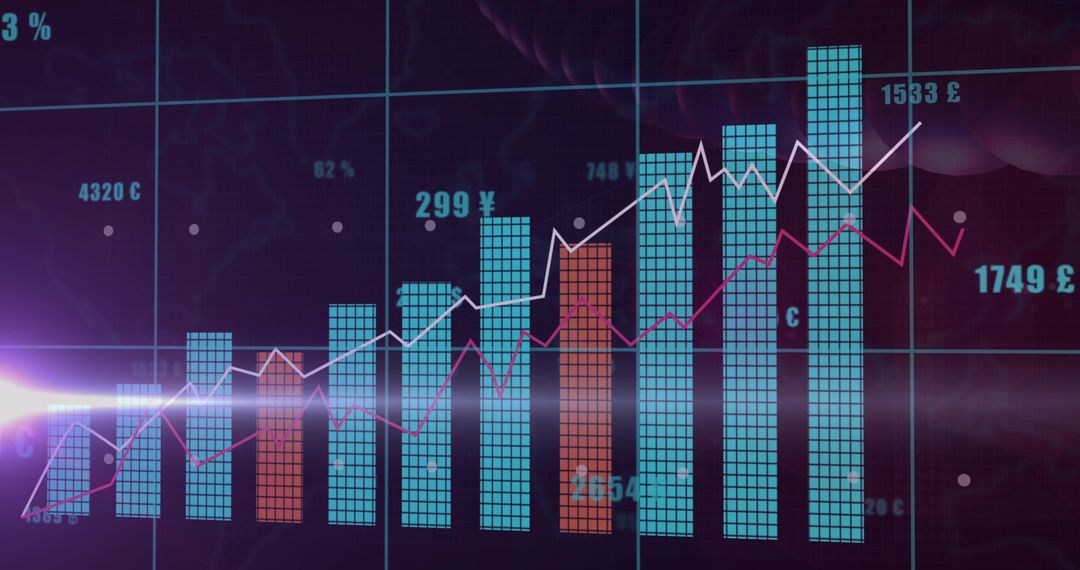
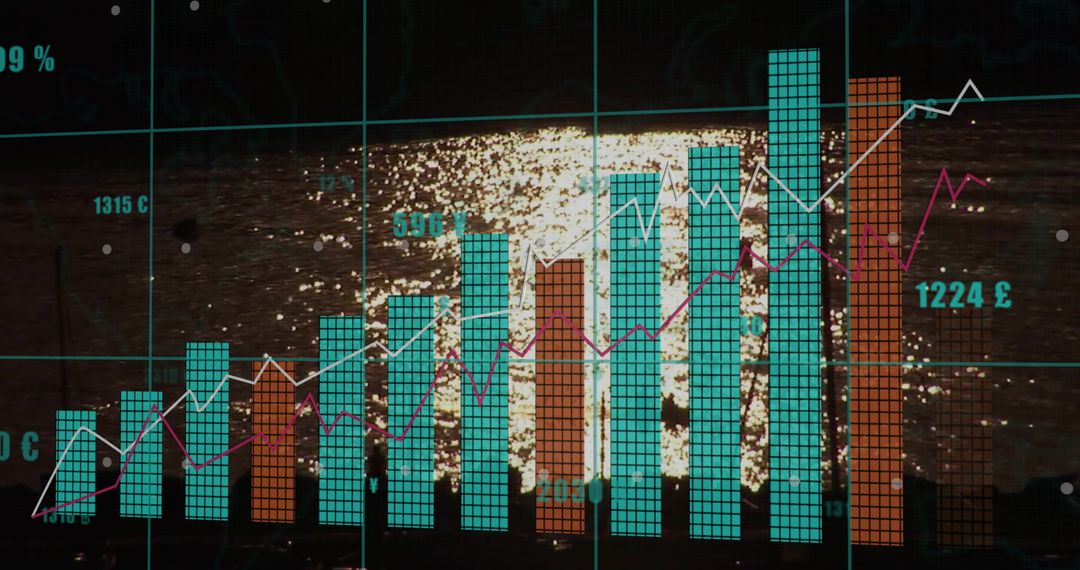
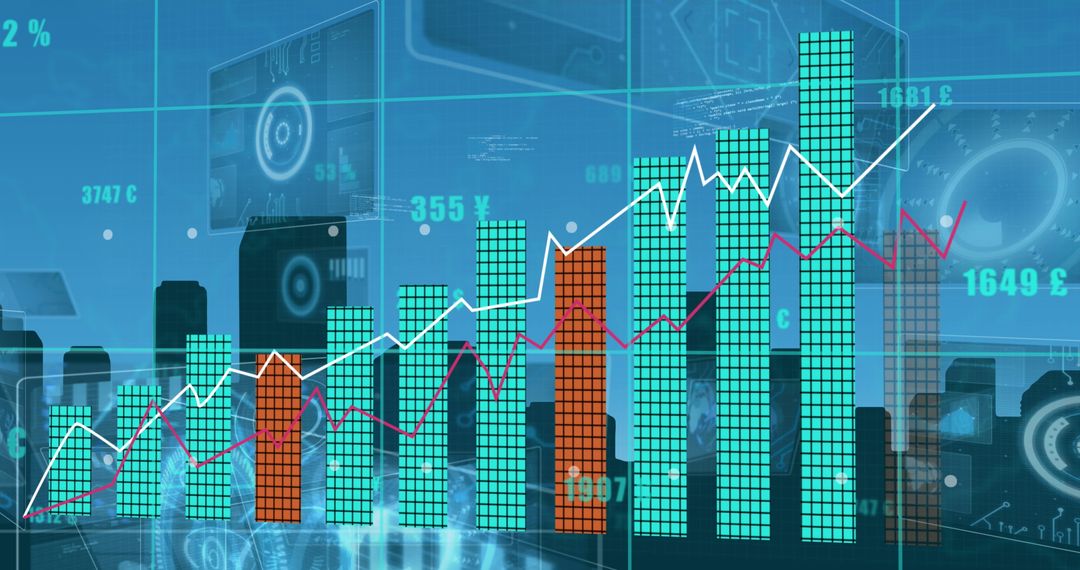
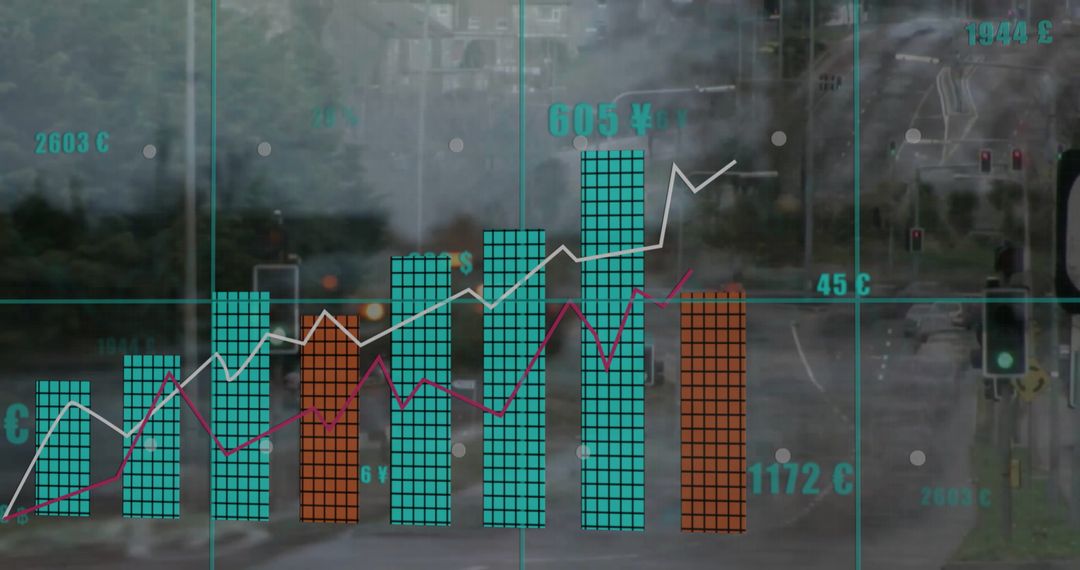
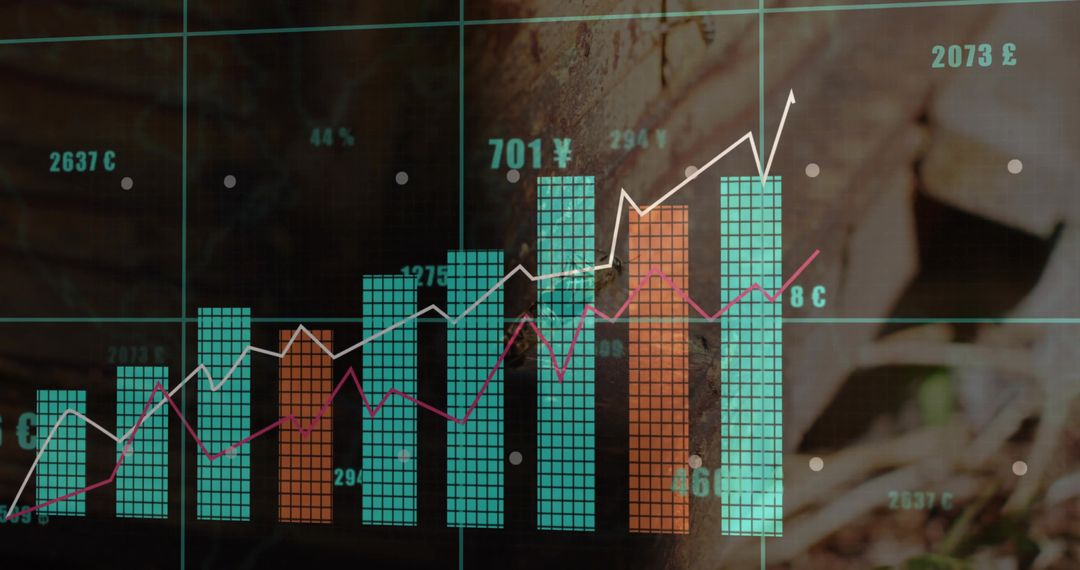
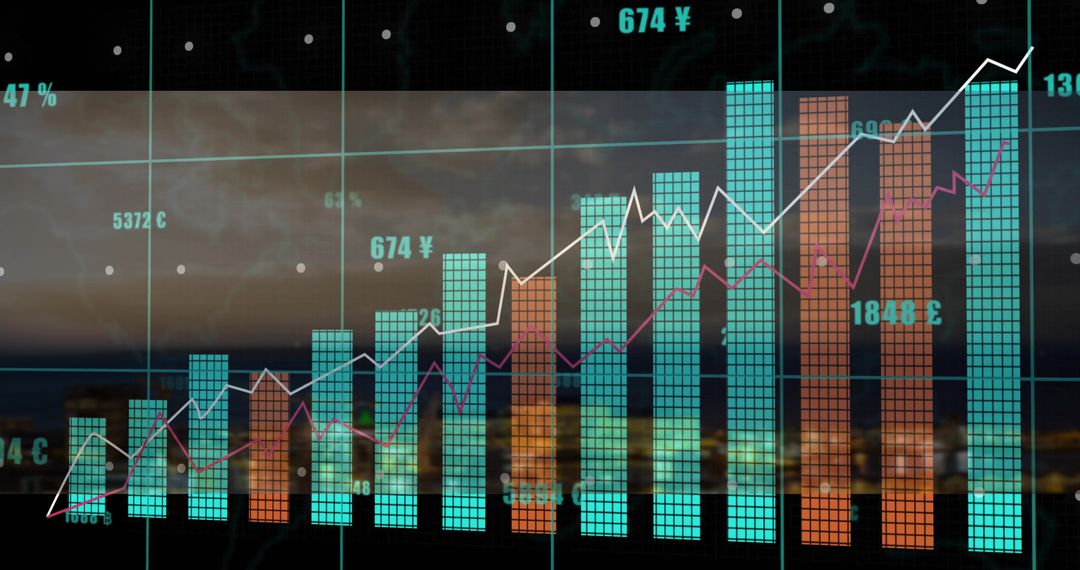
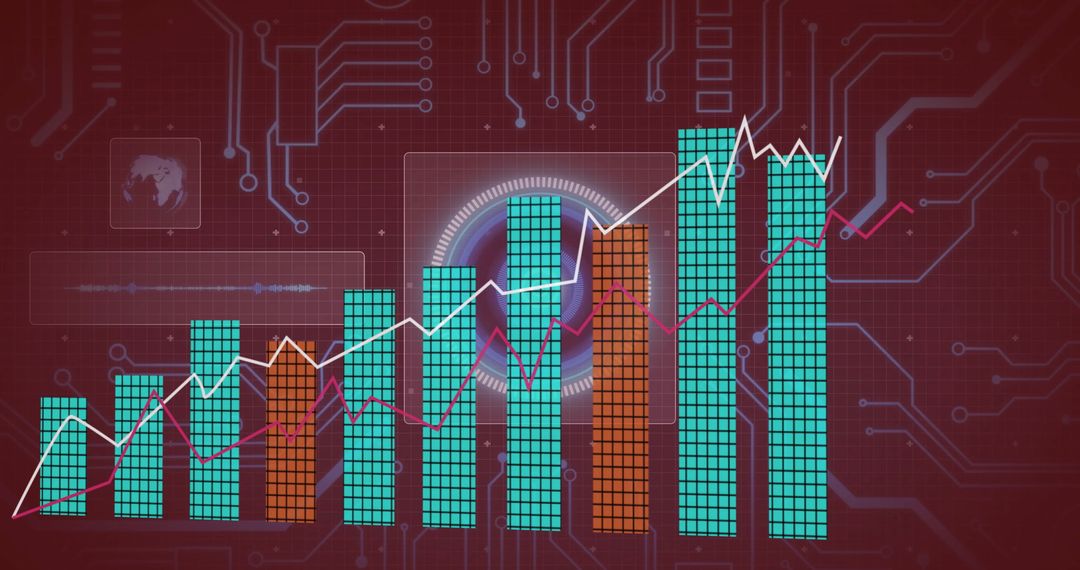
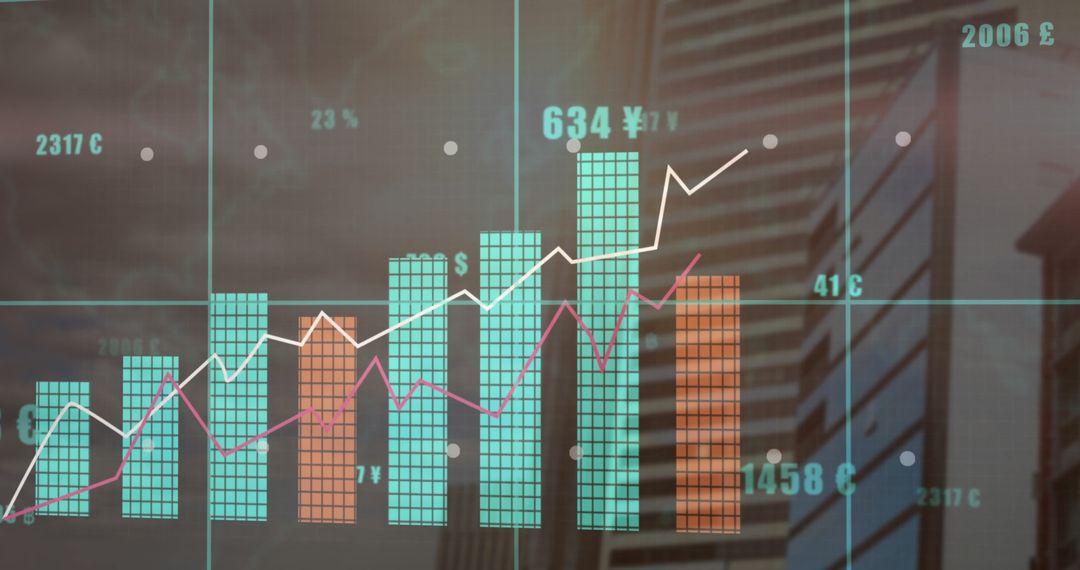
- Digital Financial Dashboard with Bar Chart and Trend Lines
Digital Financial Dashboard with Bar Chart and Trend Lines Image

Depicts a vibrant, digital financial dashboard showcasing teal and orange bar charts with trend lines against a background dotted with currency symbols. Perfect for illustrating business growth concepts, economic analysis reports, financial presentations, investment strategies, technology in finance, and statistical data communication.
Powered by 


0
downloads
downloads
Tags:
More
Credit Photo
If you would like to credit the Photo, here are some ways you can do so
Text Link
photo Link
<span class="text-link">
<span>
<a target="_blank" href=https://pikwizard.com/photo/digital-financial-dashboard-with-bar-chart-and-trend-lines/0c5a54c8da9d8928069c3d377b4c0755/>PikWizard</a>
</span>
</span>
<span class="image-link">
<span
style="margin: 0 0 20px 0; display: inline-block; vertical-align: middle; width: 100%;"
>
<a
target="_blank"
href="https://pikwizard.com/photo/digital-financial-dashboard-with-bar-chart-and-trend-lines/0c5a54c8da9d8928069c3d377b4c0755/"
style="text-decoration: none; font-size: 10px; margin: 0;"
>
<img src="https://pikwizard.com/pw/medium/0c5a54c8da9d8928069c3d377b4c0755.jpg" style="margin: 0; width: 100%;" alt="" />
<p style="font-size: 12px; margin: 0;">PikWizard</p>
</a>
</span>
</span>
Free (free of charge)
Free for personal and commercial use.
Author: Authentic Images
Similar Free Stock Images

Premium


Premium


Premium


Premium


Premium


Premium


Premium


Premium


Premium


Premium


Premium


Premium


Premium


Premium


Premium


Premium


Premium


Premium


Premium


Premium


Premium


Premium

Premium


Premium