- Home >
- Stock Photos >
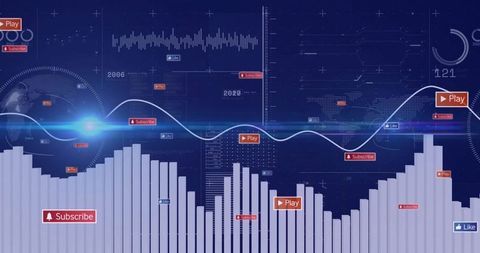
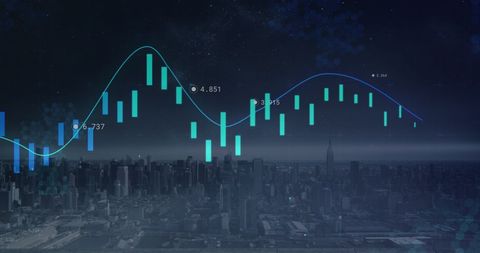
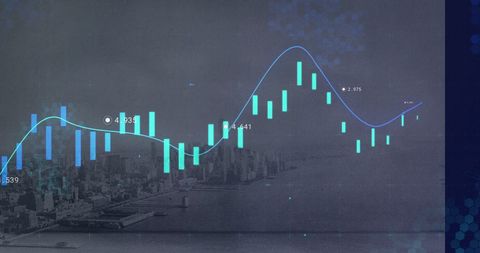
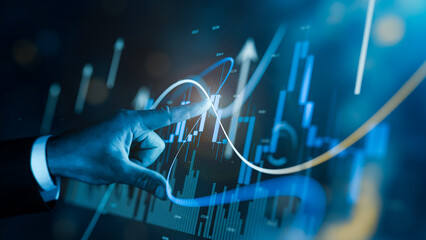
- Digital Financial Dashboard with Candlestick Chart and Interactive Icons
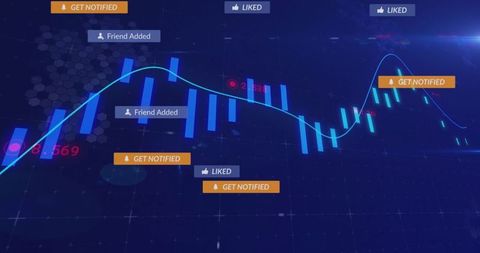
Digital Financial Dashboard with Candlestick Chart and Interactive Icons Image
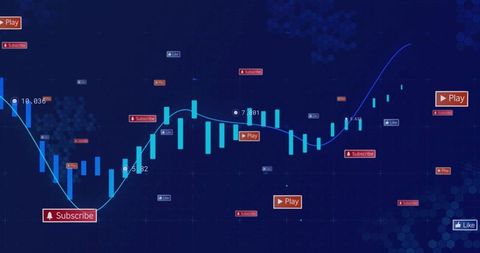
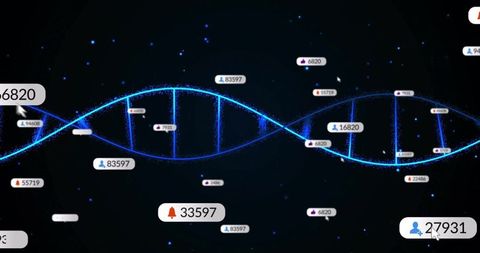
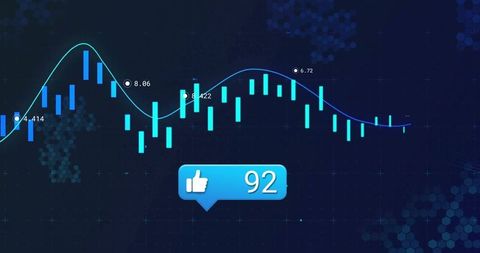
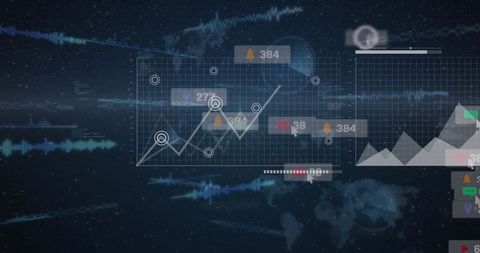
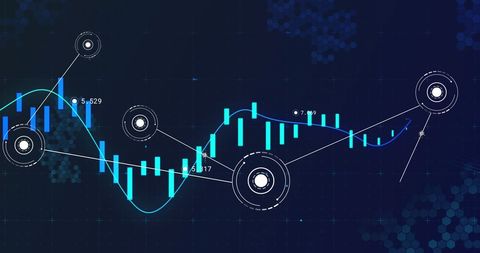
Displaying a digital financial dashboard featuring candlestick bars and a prominent trend line. The chart is populated with interactive Subscribe, Play, and Like icons, suggesting user engagement and social integration. Useful for illustrating investment applications, data analytic tools, or technologies related to financial markets and stock trading platforms. Ideal for presentations and content focusing on finance, technology, and investment-driven audiences.
Powered by 


2
downloads
downloads
Tags:
More
Credit Photo
If you would like to credit the Photo, here are some ways you can do so
Text Link
photo Link
<span class="text-link">
<span>
<a target="_blank" href=https://pikwizard.com/photo/digital-financial-dashboard-with-candlestick-chart-and-interactive-icons/51bdba2677053e4b291e0c484029e378/>PikWizard</a>
</span>
</span>
<span class="image-link">
<span
style="margin: 0 0 20px 0; display: inline-block; vertical-align: middle; width: 100%;"
>
<a
target="_blank"
href="https://pikwizard.com/photo/digital-financial-dashboard-with-candlestick-chart-and-interactive-icons/51bdba2677053e4b291e0c484029e378/"
style="text-decoration: none; font-size: 10px; margin: 0;"
>
<img src="https://pikwizard.com/pw/medium/51bdba2677053e4b291e0c484029e378.jpg" style="margin: 0; width: 100%;" alt="" />
<p style="font-size: 12px; margin: 0;">PikWizard</p>
</a>
</span>
</span>
Free (free of charge)
Free for personal and commercial use.
Author: People Creations
Similar Free Stock Images
Loading...

Premium


Premium


Premium


Premium


Premium


Premium


Premium
Premium

Premium


Premium


Premium


Premium


Premium

Premium


Premium

Premium


Premium


Premium

Premium

Premium


Premium


Premium


Premium


Premium


Premium