- Home >
- Stock Photos >
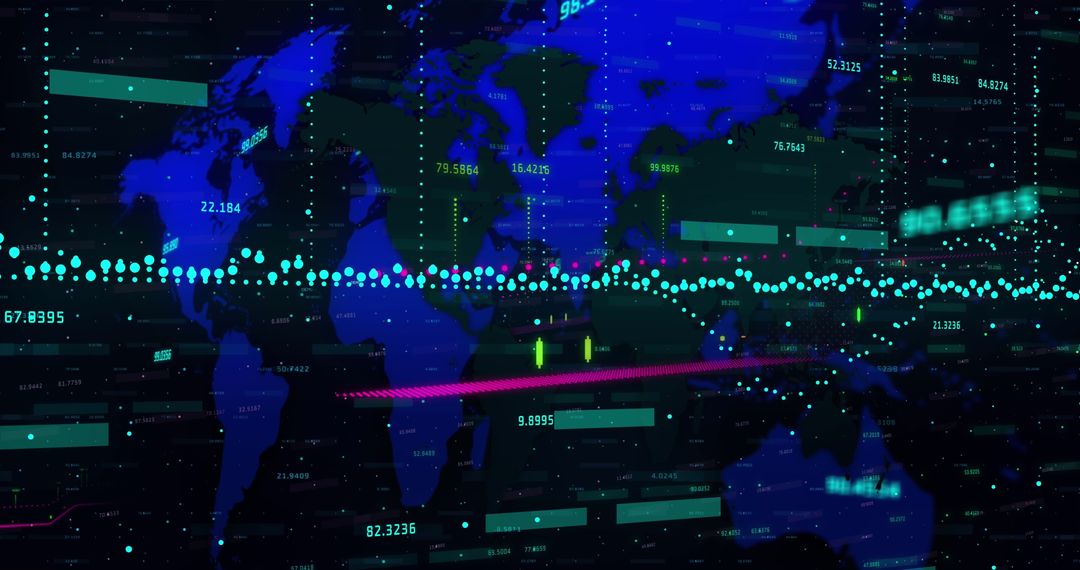
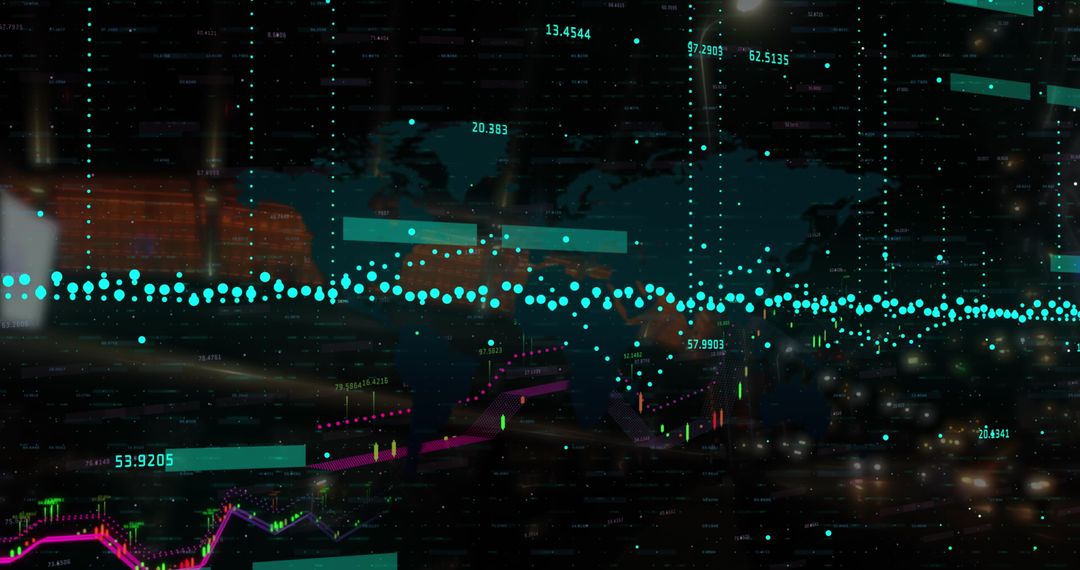
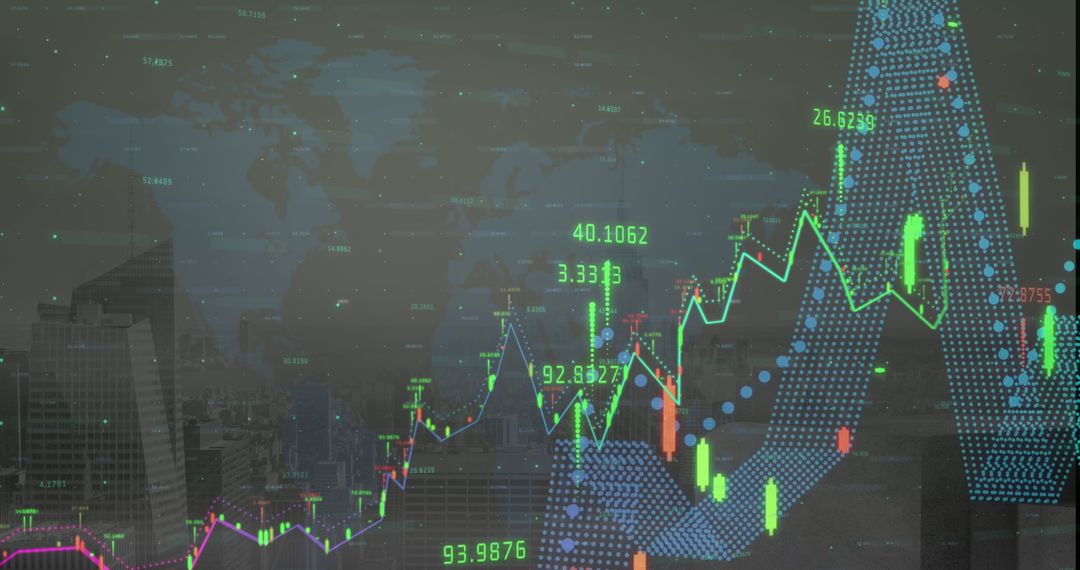
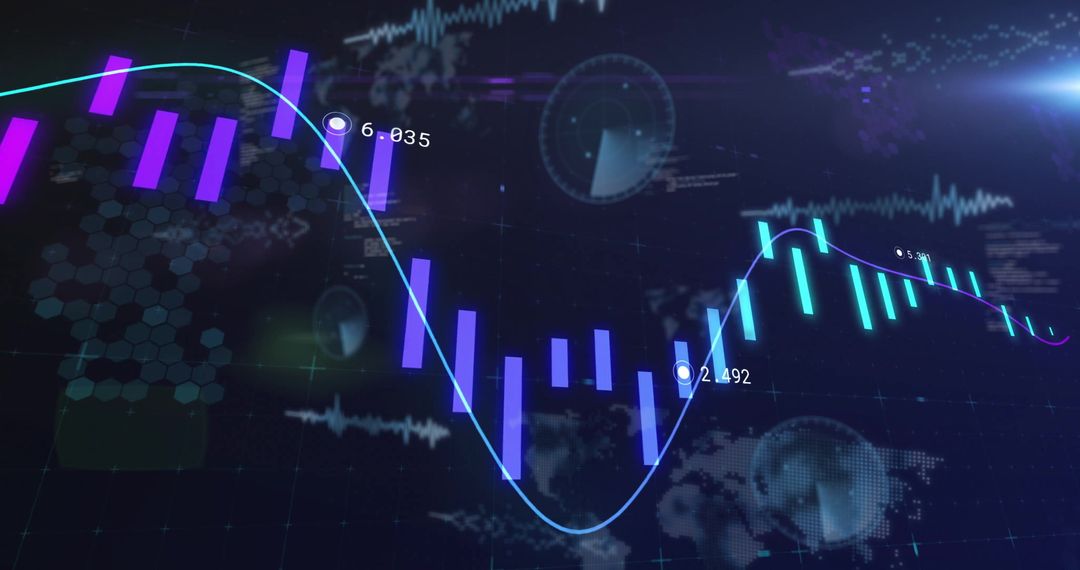
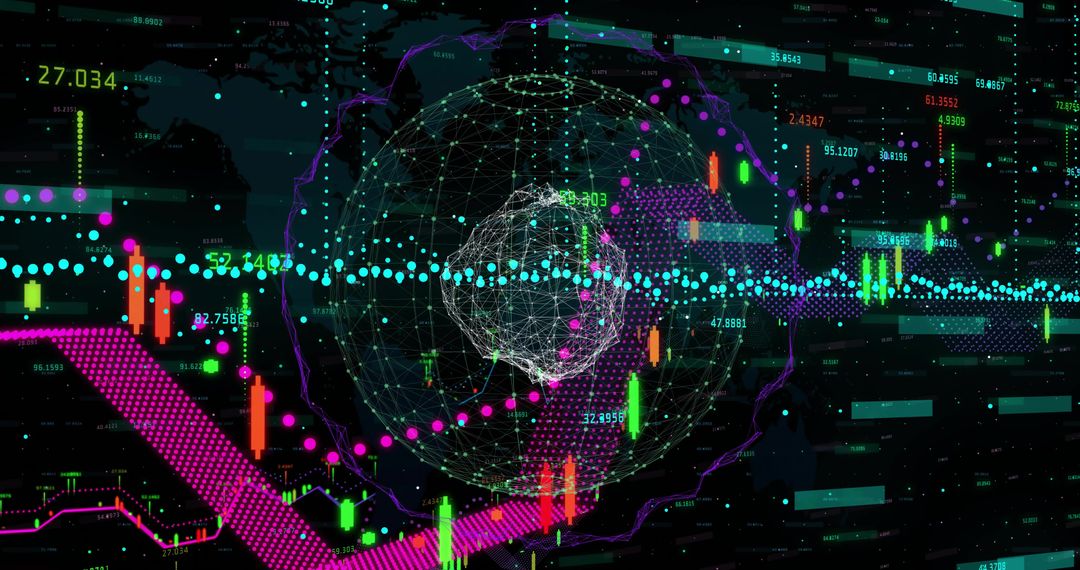
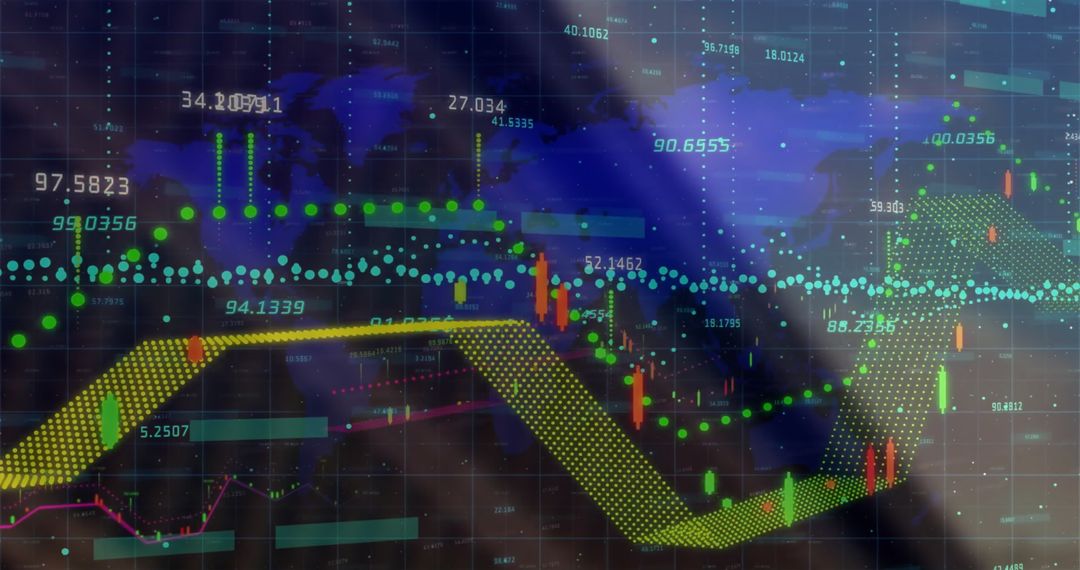
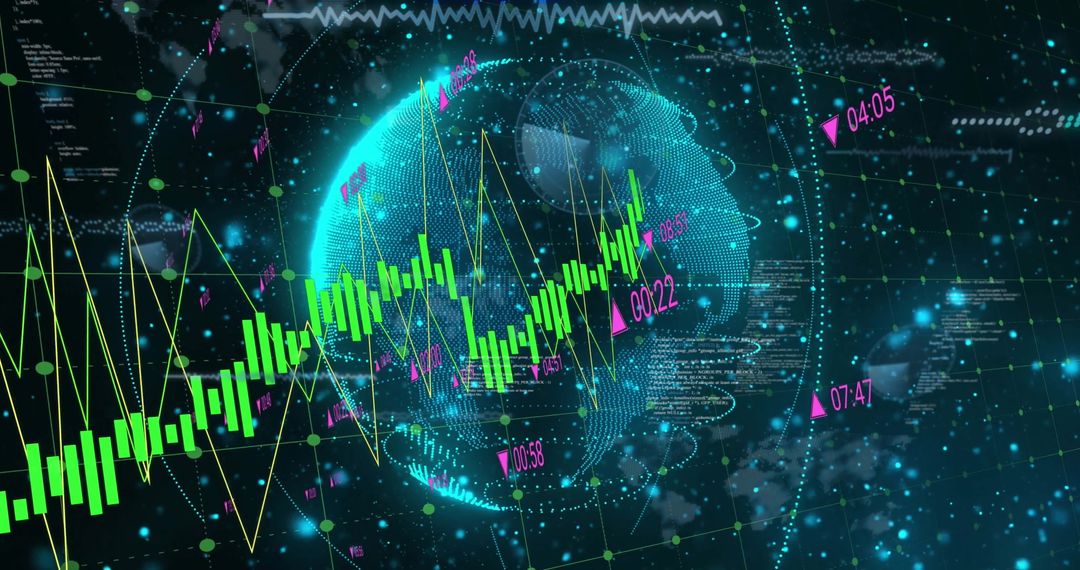
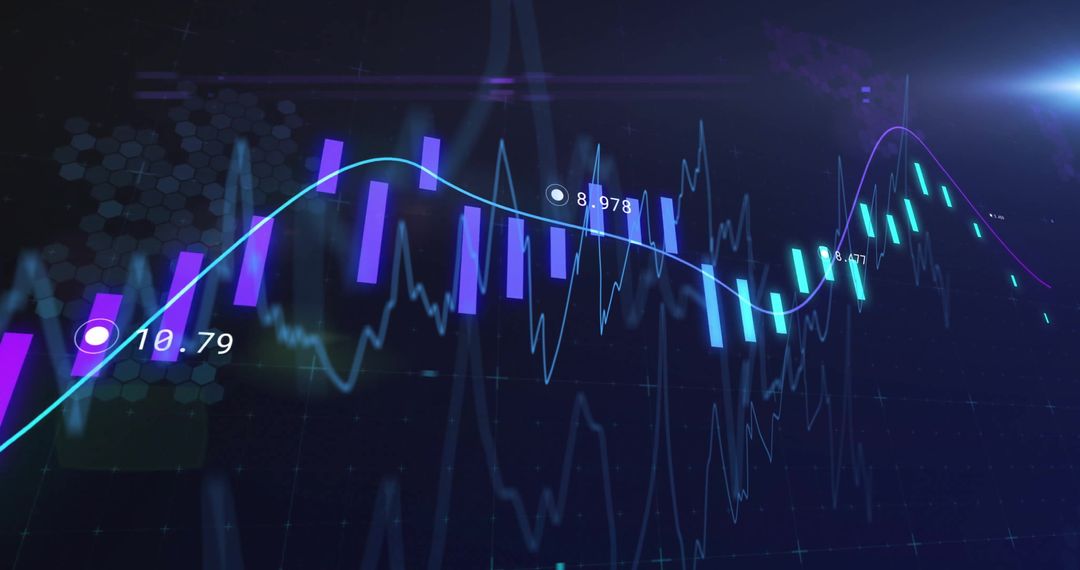
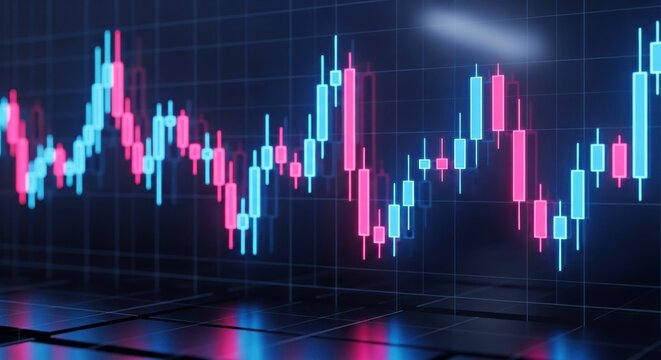
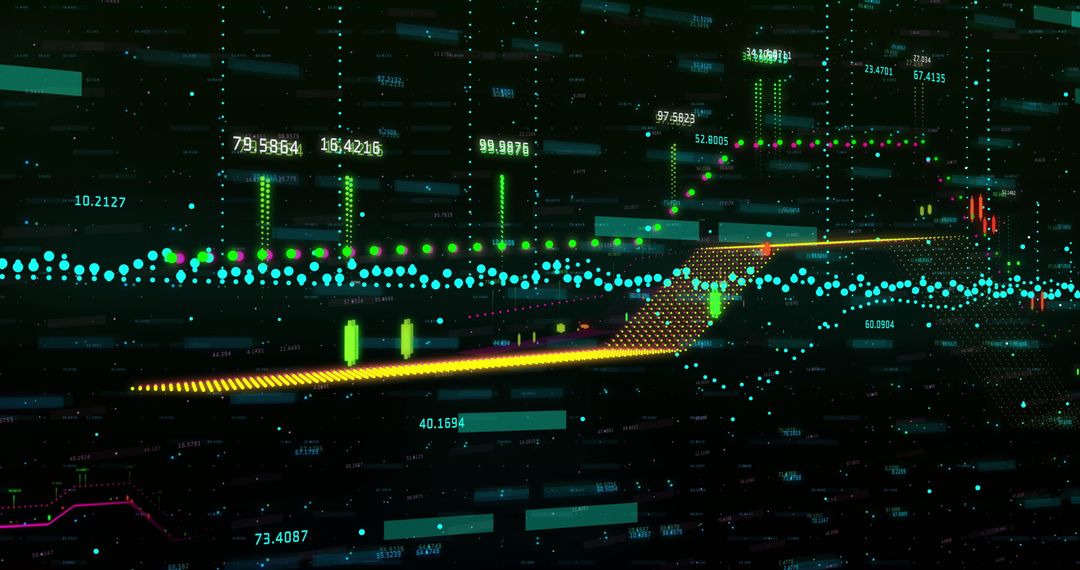
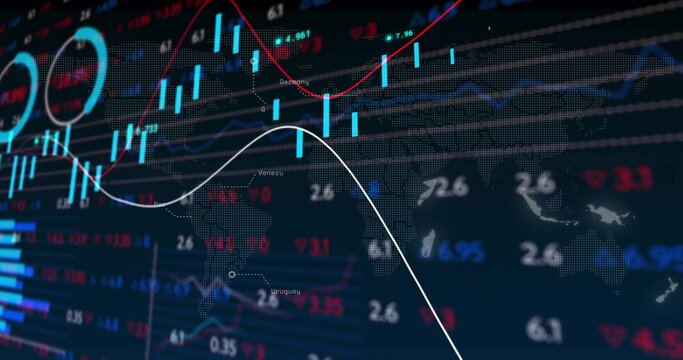
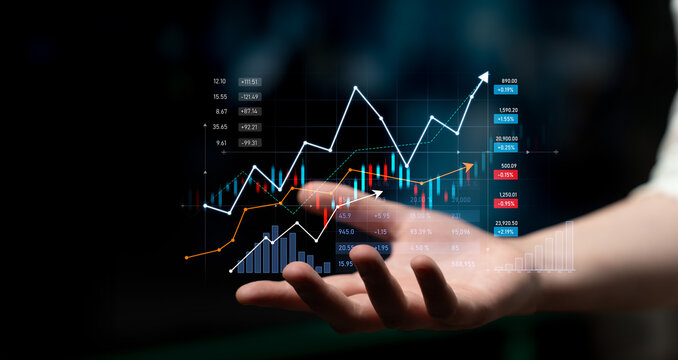
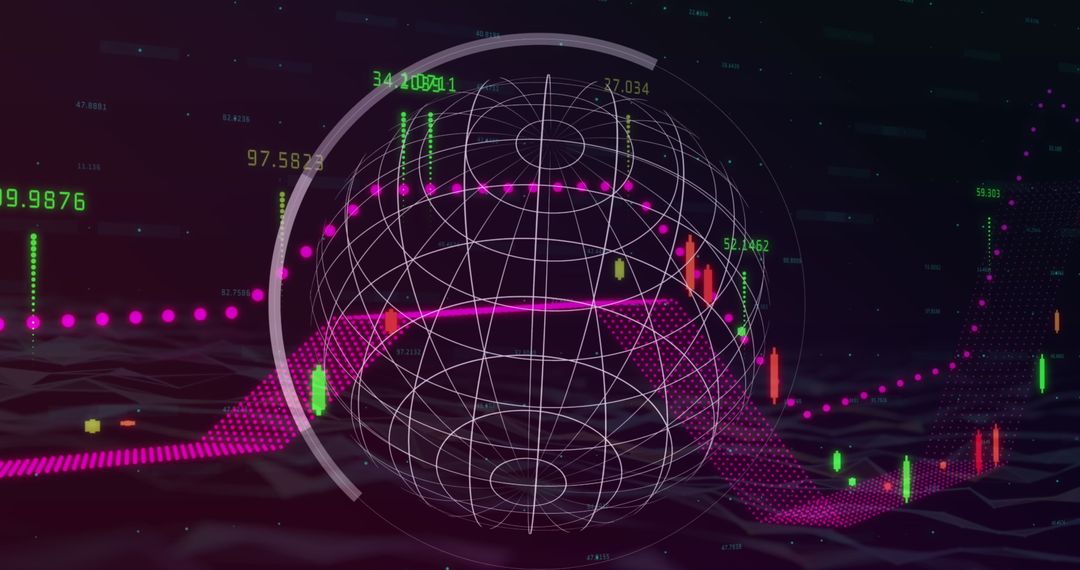
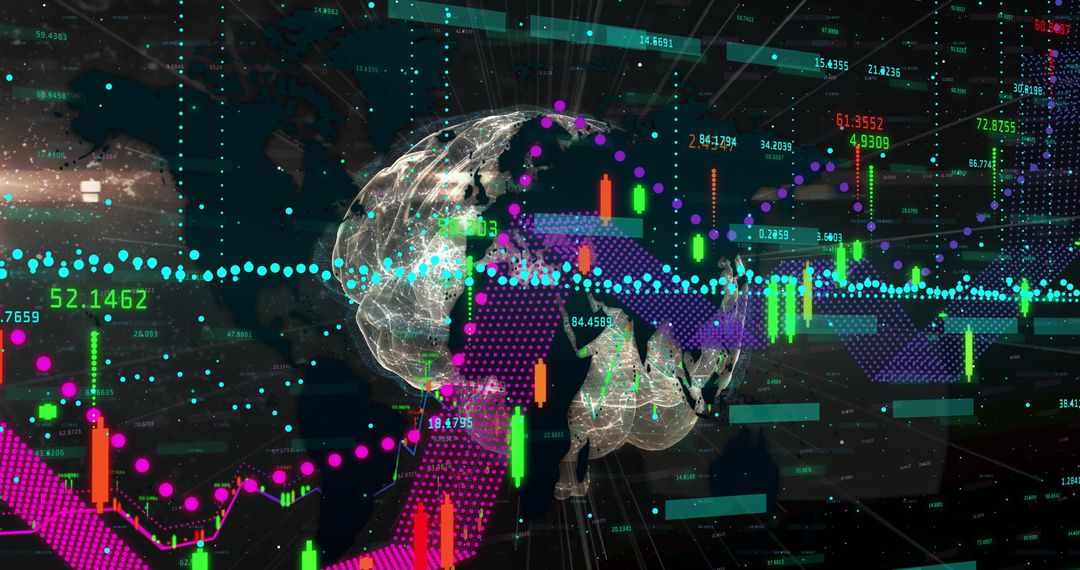
- Digital Financial Dashboard with Candlestick Chart and Orange Globe
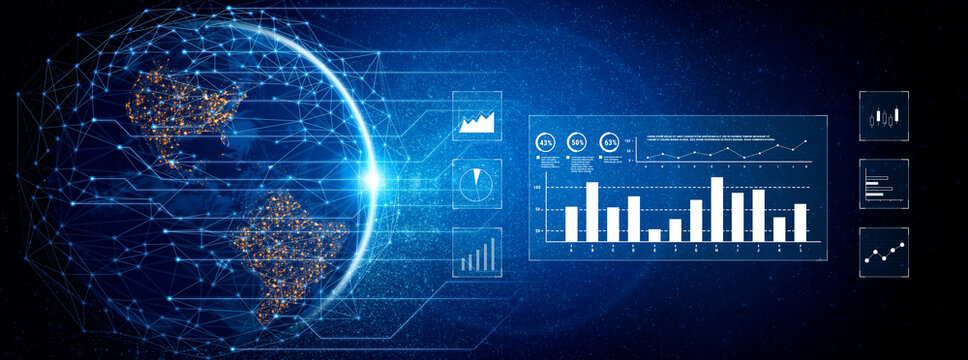
Digital Financial Dashboard with Candlestick Chart and Orange Globe Image
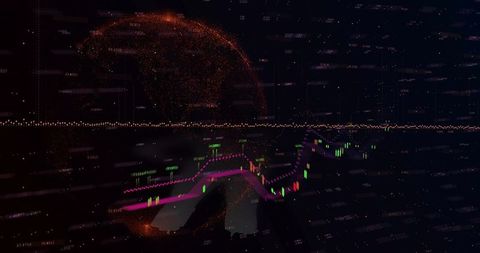
Visual demonstrates advanced financial analytics with a focus on a dynamic candlestick chart accompanied by a magenta trend line. An orange digital globe adds an international perspective reflective of global market scanning. The image may enhance fintech blogs, presentations, or educational materials illustrating trading concepts or market analysis.
Powered by 


0
downloads
downloads
Tags:
More
Credit Photo
If you would like to credit the Photo, here are some ways you can do so
Text Link
photo Link
<span class="text-link">
<span>
<a target="_blank" href=https://pikwizard.com/photo/digital-financial-dashboard-with-candlestick-chart-and-orange-globe/ac2e9c2af93da28afa36f80d88da93ac/>PikWizard</a>
</span>
</span>
<span class="image-link">
<span
style="margin: 0 0 20px 0; display: inline-block; vertical-align: middle; width: 100%;"
>
<a
target="_blank"
href="https://pikwizard.com/photo/digital-financial-dashboard-with-candlestick-chart-and-orange-globe/ac2e9c2af93da28afa36f80d88da93ac/"
style="text-decoration: none; font-size: 10px; margin: 0;"
>
<img src="https://pikwizard.com/pw/medium/ac2e9c2af93da28afa36f80d88da93ac.jpg" style="margin: 0; width: 100%;" alt="" />
<p style="font-size: 12px; margin: 0;">PikWizard</p>
</a>
</span>
</span>
Free (free of charge)
Free for personal and commercial use.
Author: Authentic Images
Similar Free Stock Images

Premium

Premium


Premium


Premium


Premium
Premium


Premium


Premium


Premium

Premium


Premium


Premium


Premium


Premium
Premium


Premium


Premium

Premium


Premium


Premium


Premium


Premium


Premium


Premium