- Home >
- Stock Photos >
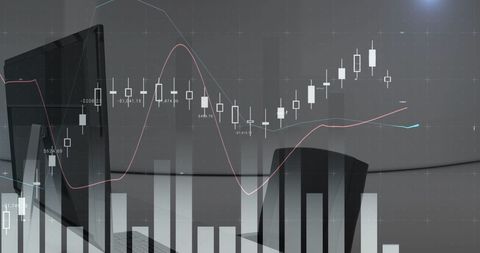
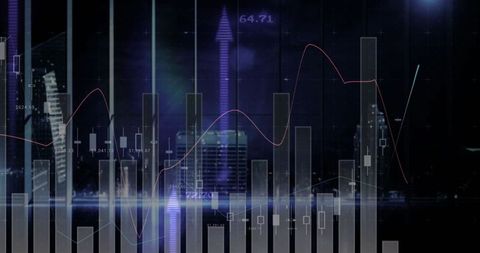
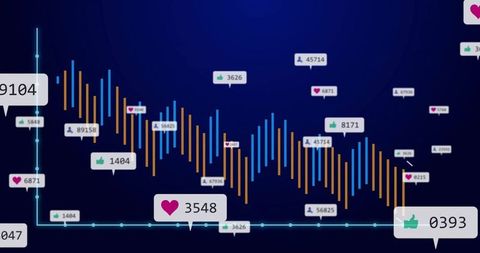
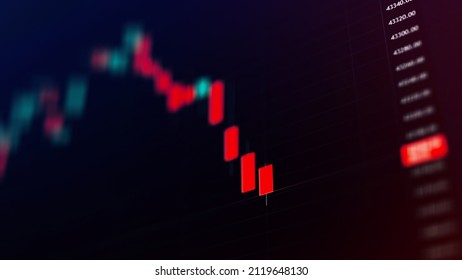
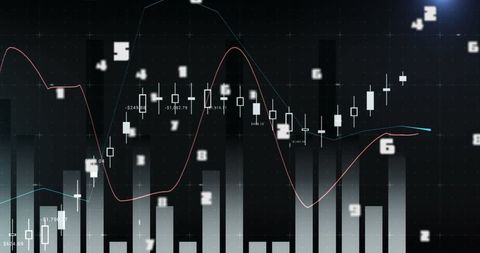
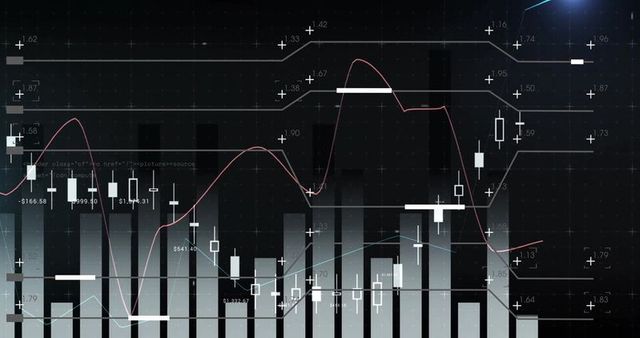
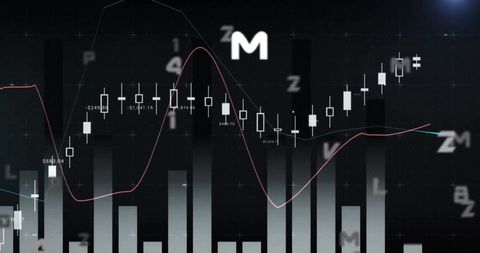
- Digital Financial Dashboard with Candlestick Charts and Trend Analysis
Digital Financial Dashboard with Candlestick Charts and Trend Analysis Image

Dynamic representation of a digital financial dashboard showing candlestick charts mixed with histograms and trend lines. Useful in presentations about stock market analysis, trading platforms or financial technology seminars. Ideal for showcasing complex data analytics and interactive data interfaces for investors and traders.
Powered by  - Get 15% off with code: PIKWIZARD15


0
downloads
downloads
Tags:
More
Credit Photo
If you would like to credit the Photo, here are some ways you can do so
Text Link
photo Link
<span class="text-link">
<span>
<a target="_blank" href=https://pikwizard.com/photo/digital-financial-dashboard-with-candlestick-charts-and-trend-analysis/89017ce22e4280b922350efa59fa6773/>PikWizard</a>
</span>
</span>
<span class="image-link">
<span
style="margin: 0 0 20px 0; display: inline-block; vertical-align: middle; width: 100%;"
>
<a
target="_blank"
href="https://pikwizard.com/photo/digital-financial-dashboard-with-candlestick-charts-and-trend-analysis/89017ce22e4280b922350efa59fa6773/"
style="text-decoration: none; font-size: 10px; margin: 0;"
>
<img src="https://pikwizard.com/pw/medium/89017ce22e4280b922350efa59fa6773.jpg" style="margin: 0; width: 100%;" alt="" />
<p style="font-size: 12px; margin: 0;">PikWizard</p>
</a>
</span>
</span>
Free (free of charge)
Free for personal and commercial use.
Author: Creative Art
Similar Free Stock Images
Loading...

Premium


Premium

Premium


Premium


Premium

Premium


Premium

Premium


Premium


Premium

Premium


Premium


Premium


Premium


Premium

Premium

Premium


Premium

Premium


Premium

Premium


Premium


Premium

Premium


Premium