
- Home >
- Stock Photos >
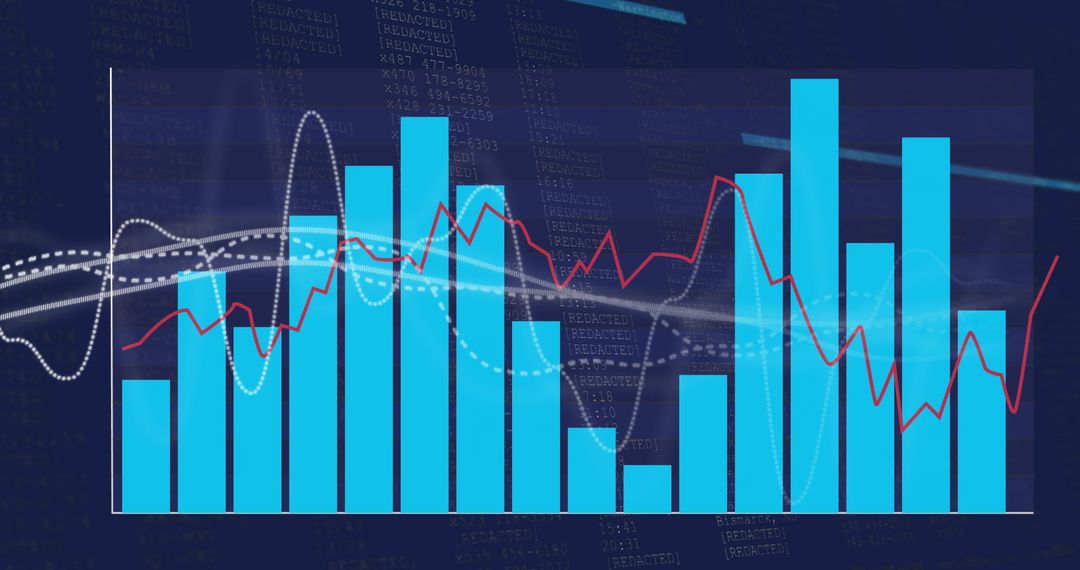
- Digital Financial Dashboard with Cyan Bar and Red Line Graph
Digital Financial Dashboard with Cyan Bar and Red Line Graph Image

Dynamic digital display shows financial data with descending cyan bars and red trend line, offering a vivid visualization for analysis. Useful for presentations, finance and technology articles, and investment analytics platforms to illustrate market trends and data interpretations.
Powered by  - Get 15% off with code: PIKWIZARD15


0
downloads
downloads
Tags:
More
Credit Photo
If you would like to credit the Photo, here are some ways you can do so
Text Link
photo Link
<span class="text-link">
<span>
<a target="_blank" href=https://pikwizard.com/photo/digital-financial-dashboard-with-cyan-bar-and-red-line-graph/7c2e5963f0c33f239e1d281457dfdf16/>PikWizard</a>
</span>
</span>
<span class="image-link">
<span
style="margin: 0 0 20px 0; display: inline-block; vertical-align: middle; width: 100%;"
>
<a
target="_blank"
href="https://pikwizard.com/photo/digital-financial-dashboard-with-cyan-bar-and-red-line-graph/7c2e5963f0c33f239e1d281457dfdf16/"
style="text-decoration: none; font-size: 10px; margin: 0;"
>
<img src="https://pikwizard.com/pw/medium/7c2e5963f0c33f239e1d281457dfdf16.jpg" style="margin: 0; width: 100%;" alt="" />
<p style="font-size: 12px; margin: 0;">PikWizard</p>
</a>
</span>
</span>
Free (free of charge)
Free for personal and commercial use.
Author: People Creations
Similar Free Stock Images

Premium


Premium


Premium


Premium


Premium


Premium


Premium


Premium


Premium


Premium


Premium


Premium


Premium


Premium


Premium


Premium


Premium


Premium


Premium


Premium


Premium


Premium


Premium


Premium

