
- Home >
- Stock Photos >
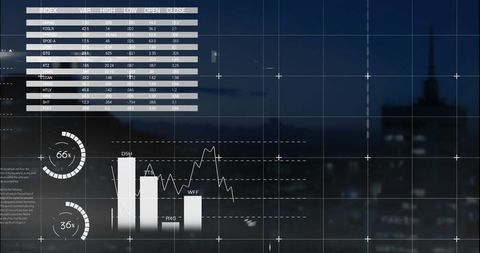
- Digital Financial Dashboard with Data Charts and Analytics
Digital Financial Dashboard with Data Charts and Analytics Image
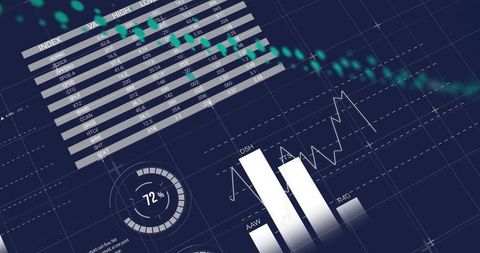
A dynamic digital dashboard showcasing key financial data with tables, charts, a gauge, and analytics underneath. Ideal for illustrating concepts related to technology, financial reporting, business presentation, or data analysis. Can be used for marketing purposes, reports, or background illustrations in financial technology-centered projects.
Powered by 


downloads
Tags:
More
Credit Photo
If you would like to credit the Photo, here are some ways you can do so
Text Link
photo Link
<span class="text-link">
<span>
<a target="_blank" href=https://pikwizard.com/photo/digital-financial-dashboard-with-data-charts-and-analytics/e0817d4e2087e5e08ee7daeef2153453/>PikWizard</a>
</span>
</span>
<span class="image-link">
<span
style="margin: 0 0 20px 0; display: inline-block; vertical-align: middle; width: 100%;"
>
<a
target="_blank"
href="https://pikwizard.com/photo/digital-financial-dashboard-with-data-charts-and-analytics/e0817d4e2087e5e08ee7daeef2153453/"
style="text-decoration: none; font-size: 10px; margin: 0;"
>
<img src="https://pikwizard.com/pw/medium/e0817d4e2087e5e08ee7daeef2153453.jpg" style="margin: 0; width: 100%;" alt="" />
<p style="font-size: 12px; margin: 0;">PikWizard</p>
</a>
</span>
</span>
Free (free of charge)
Free for personal and commercial use.
Author: Creative Art
Similar Free Stock Images
Premium


Premium


Premium


Premium


Premium


Premium


Premium


Premium


Premium

Premium


Premium


Premium


Premium


Premium


Premium

Premium


Premium

Premium


Premium


Premium


Premium

Premium


Premium


Premium


Premium


Explore More Free Stock Images