
- Home >
- Stock Photos >
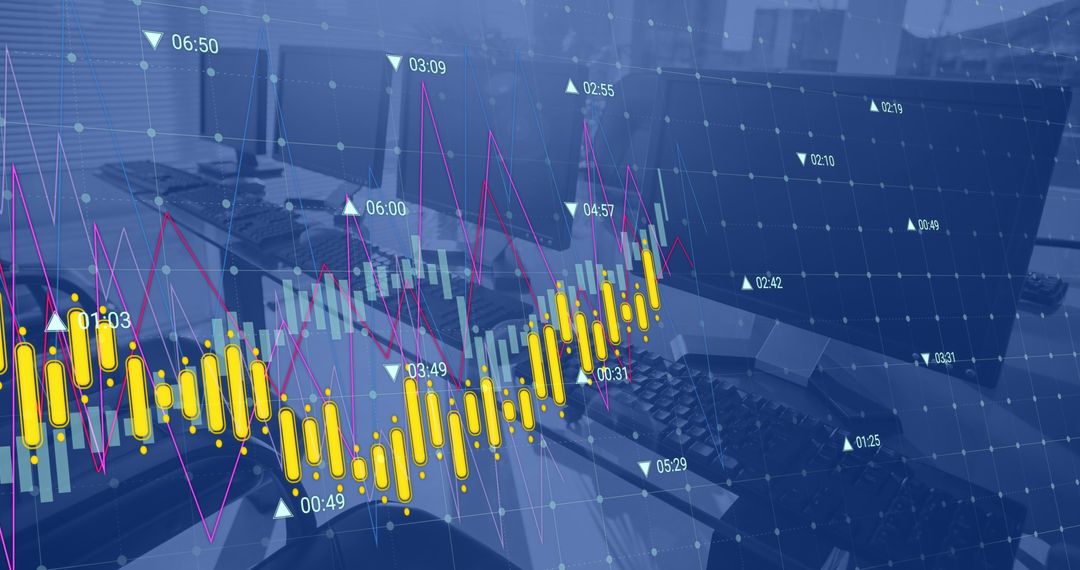
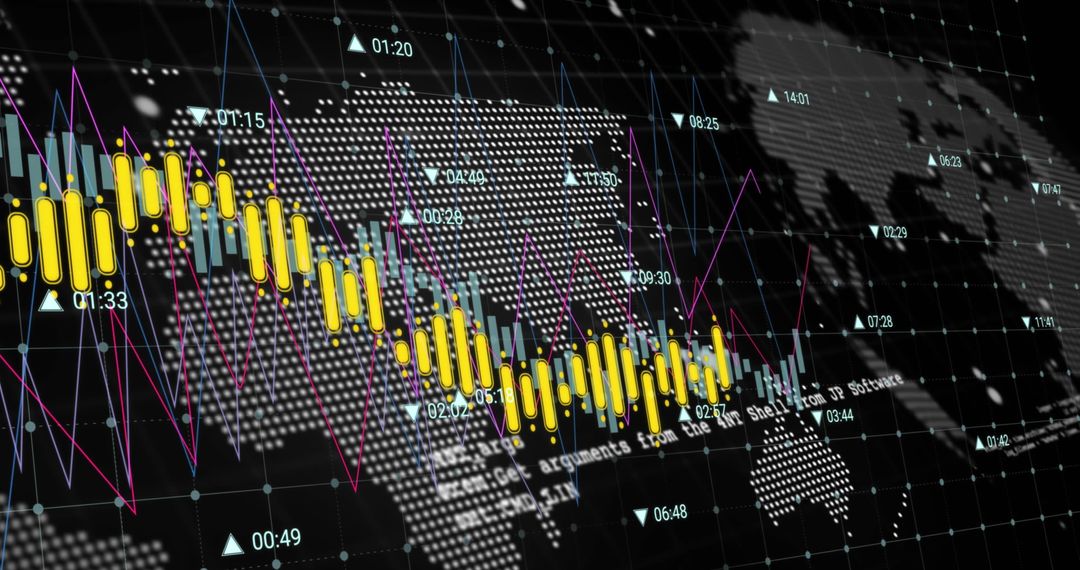
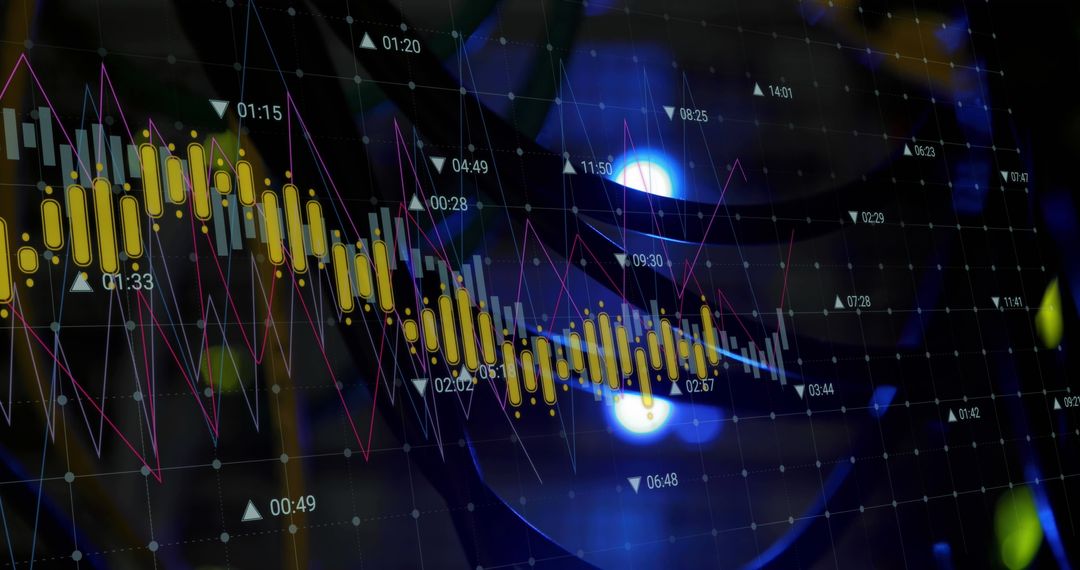
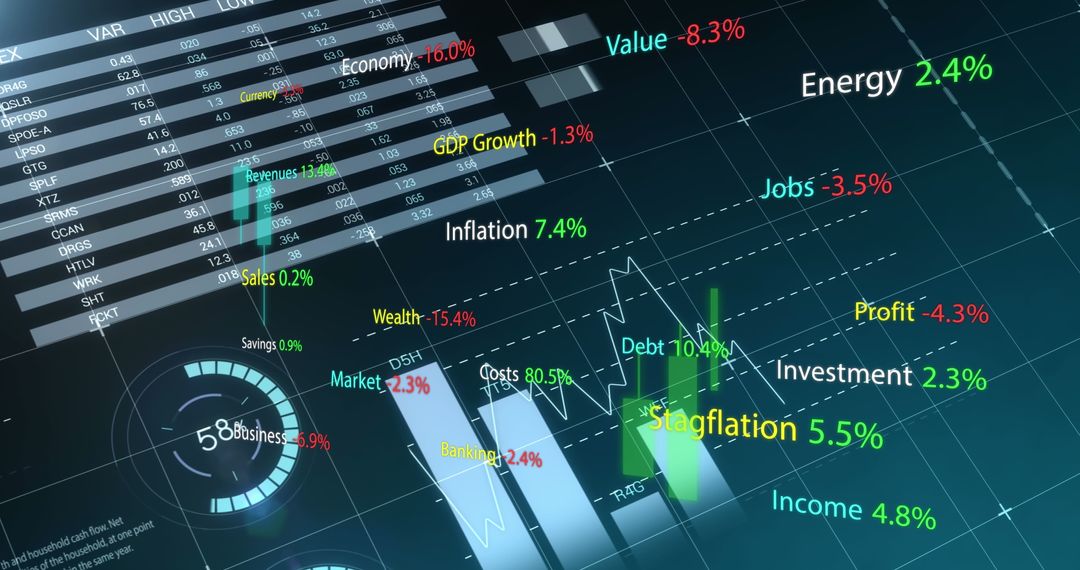
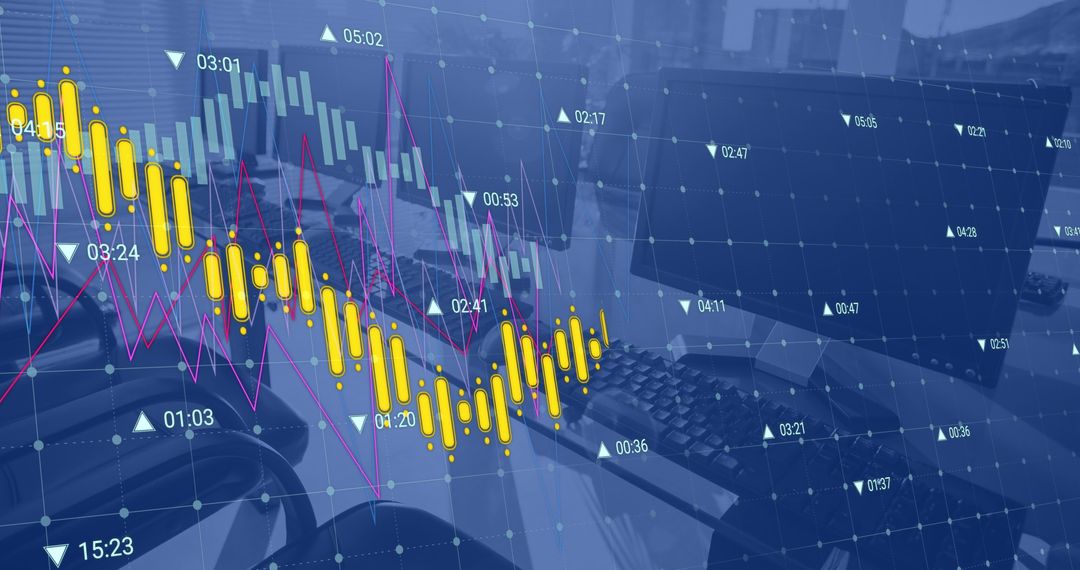
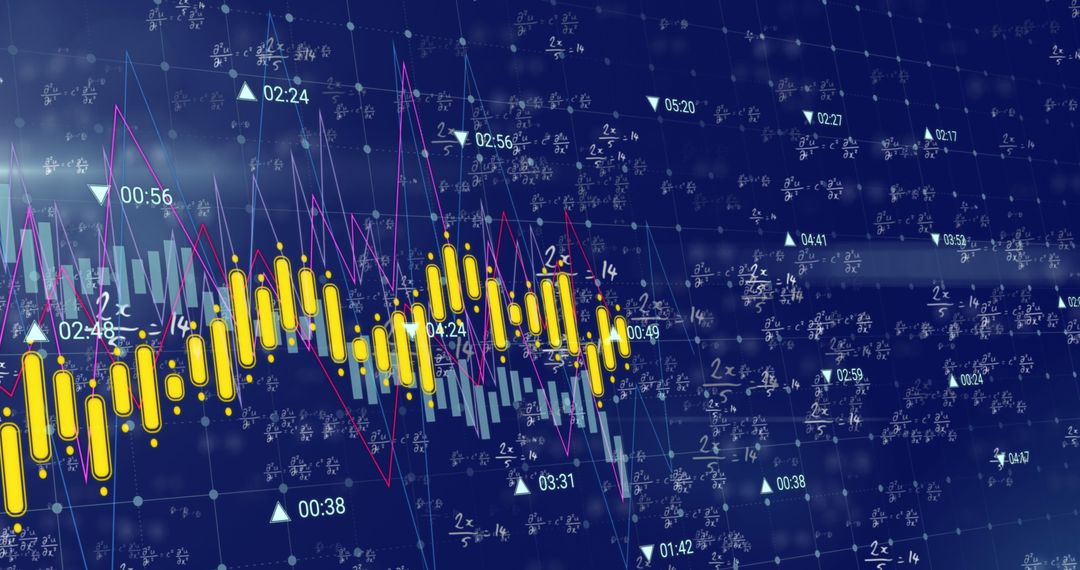
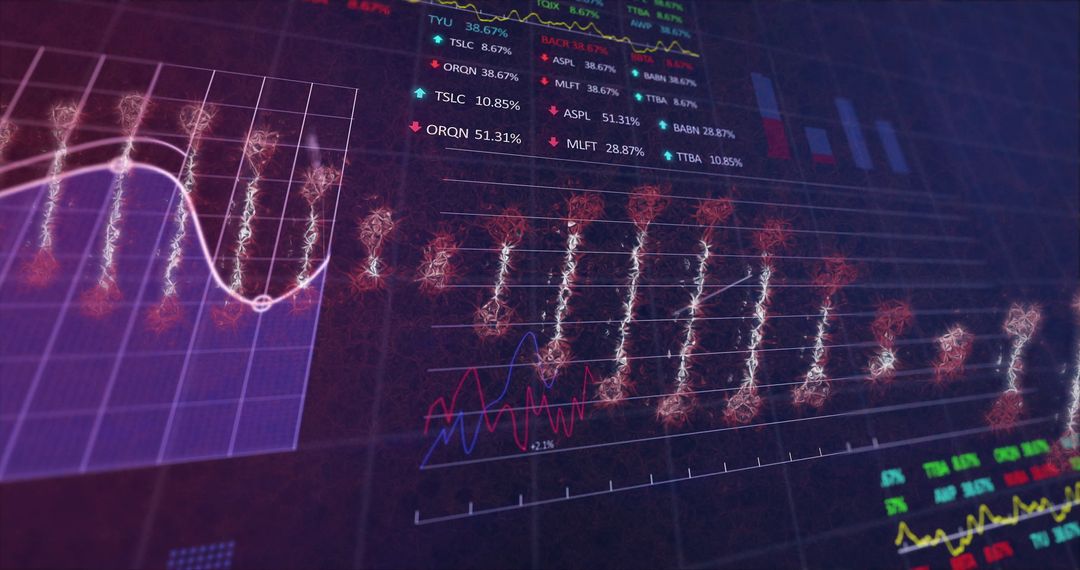
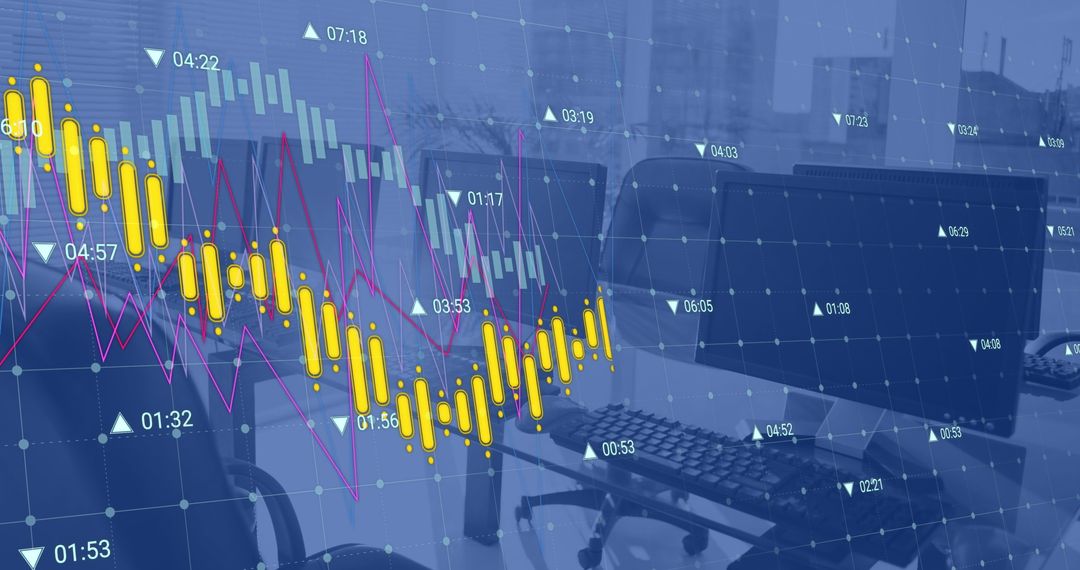
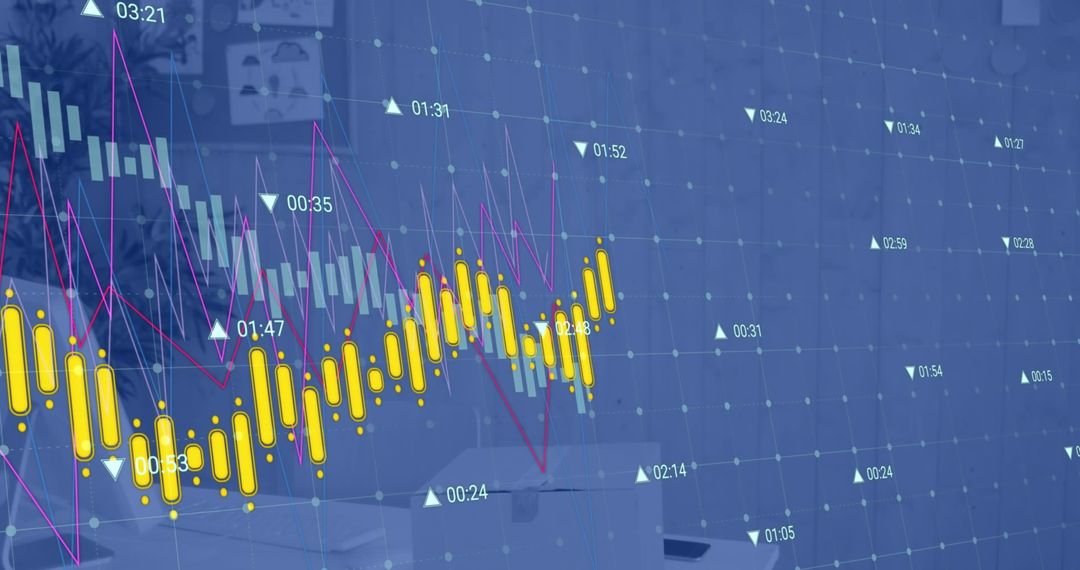
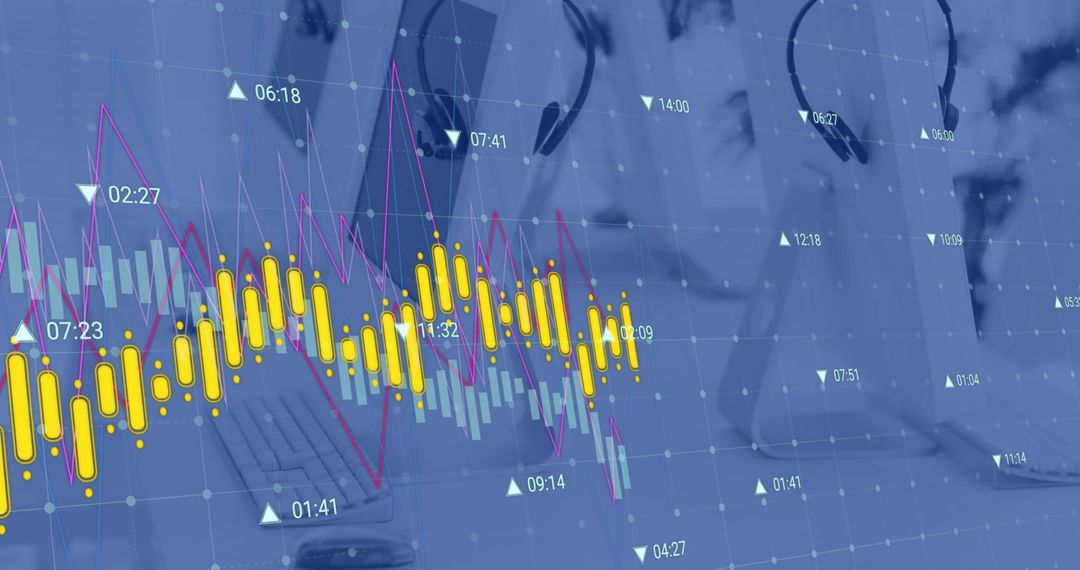
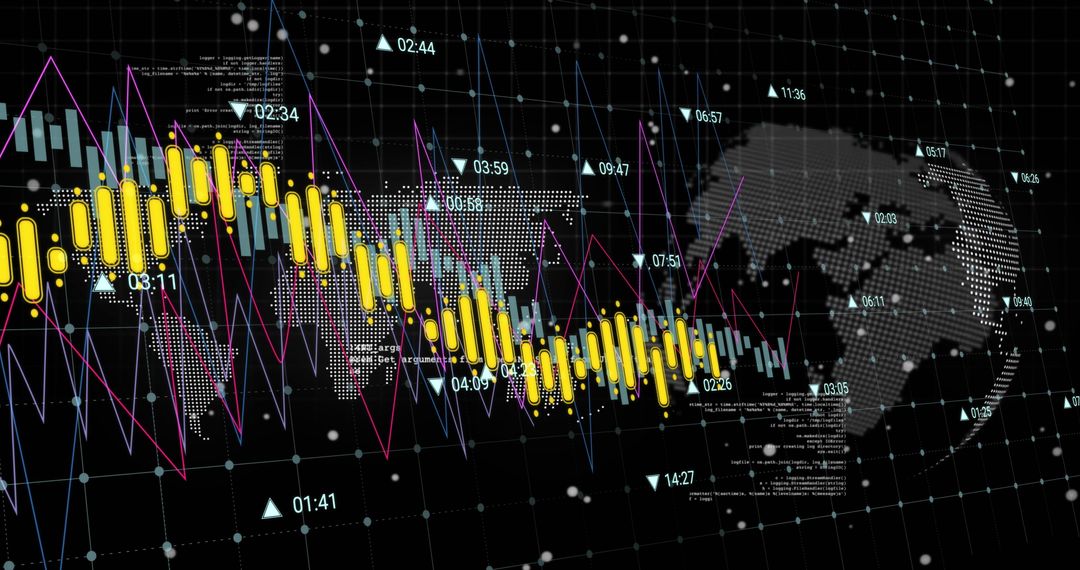
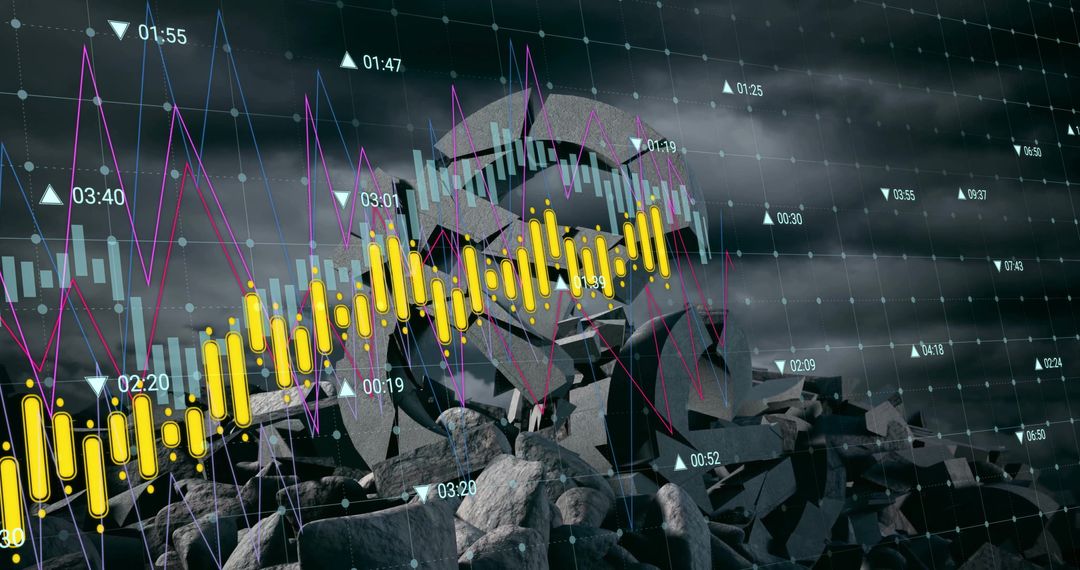
- Digital Financial Dashboard with Illuminated Charts and Graphs
Digital Financial Dashboard with Illuminated Charts and Graphs Image

Illustration of complex financial data showing charts with candlestick and histogram formats alongside line graphs on a digital dashboard. Suitable for financial websites, stock market education materials, and presentations on technology-driven trading and analytics.
Powered by  - Get 15% off with code: PIKWIZARD15


2
downloads
downloads
Tags:
More
Credit Photo
If you would like to credit the Photo, here are some ways you can do so
Text Link
photo Link
<span class="text-link">
<span>
<a target="_blank" href=https://pikwizard.com/photo/digital-financial-dashboard-with-illuminated-charts-and-graphs/4756aeca8a2d5c45791945b8e5232c38/>PikWizard</a>
</span>
</span>
<span class="image-link">
<span
style="margin: 0 0 20px 0; display: inline-block; vertical-align: middle; width: 100%;"
>
<a
target="_blank"
href="https://pikwizard.com/photo/digital-financial-dashboard-with-illuminated-charts-and-graphs/4756aeca8a2d5c45791945b8e5232c38/"
style="text-decoration: none; font-size: 10px; margin: 0;"
>
<img src="https://pikwizard.com/pw/medium/4756aeca8a2d5c45791945b8e5232c38.jpg" style="margin: 0; width: 100%;" alt="" />
<p style="font-size: 12px; margin: 0;">PikWizard</p>
</a>
</span>
</span>
Free (free of charge)
Free for personal and commercial use.
Author: Authentic Images
Similar Free Stock Images

Premium


Premium


Premium

Premium


Premium


Premium


Premium


Premium


Premium


Premium


Premium


Premium


Premium


Premium


Premium


Premium

Premium


Premium


Premium

Premium


Premium


Premium


Premium


Premium

