- Home >
- Stock Photos >
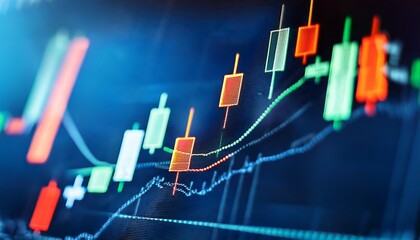
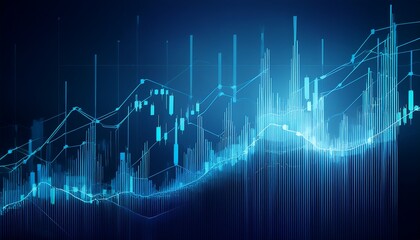
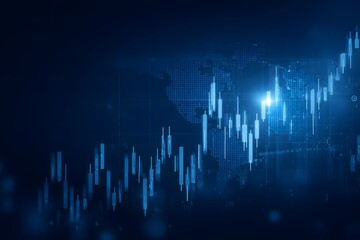
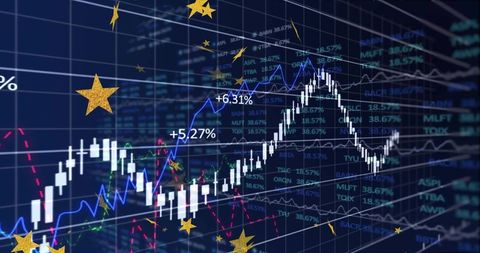
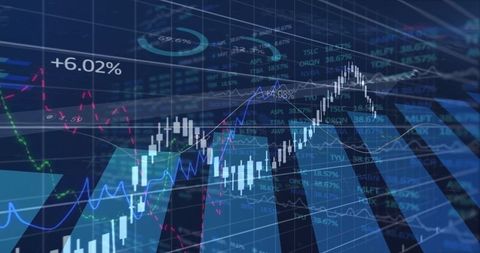
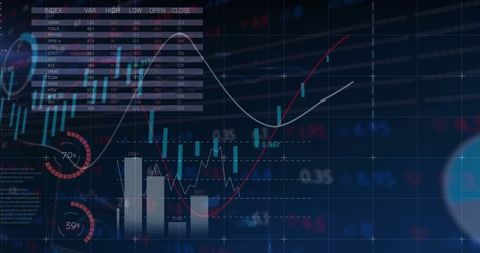
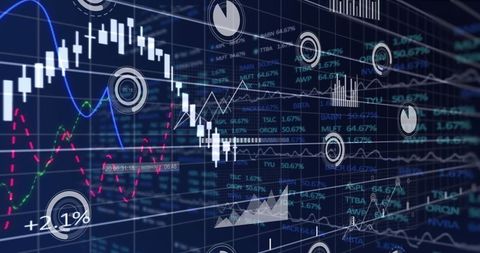
- Digital Financial Dashboard with Rising Candlestick Chart
Digital Financial Dashboard with Rising Candlestick Chart Image

High-tech representation of a financial dashboard featuring a prominently rising white candlestick chart. The graph includes interactive elements such as blue and red lines and a +6.02% growth label. Ideal for use in finance reports, economic articles, data analysis presentations, or investment portfolio reviews. It highlights advancements in technology in data visualization tools used for monitoring stock market trends.
Powered by 


0
downloads
downloads
Tags:
More
Credit Photo
If you would like to credit the Photo, here are some ways you can do so
Text Link
photo Link
<span class="text-link">
<span>
<a target="_blank" href=https://pikwizard.com/photo/digital-financial-dashboard-with-rising-candlestick-chart/f6e0b5442081f440e671a35dfb93e185/>PikWizard</a>
</span>
</span>
<span class="image-link">
<span
style="margin: 0 0 20px 0; display: inline-block; vertical-align: middle; width: 100%;"
>
<a
target="_blank"
href="https://pikwizard.com/photo/digital-financial-dashboard-with-rising-candlestick-chart/f6e0b5442081f440e671a35dfb93e185/"
style="text-decoration: none; font-size: 10px; margin: 0;"
>
<img src="https://pikwizard.com/pw/medium/f6e0b5442081f440e671a35dfb93e185.jpg" style="margin: 0; width: 100%;" alt="" />
<p style="font-size: 12px; margin: 0;">PikWizard</p>
</a>
</span>
</span>
Free (free of charge)
Free for personal and commercial use.
Author: Awesome Content
Similar Free Stock Images
Loading...

Premium

Premium


Premium


Premium


Premium


Premium

Premium


Premium


Premium


Premium


Premium
Premium


Premium


Premium


Premium


Premium


Premium


Premium

Premium


Premium


Premium


Premium


Premium


Premium


Premium