- Home >
- Stock Photos >
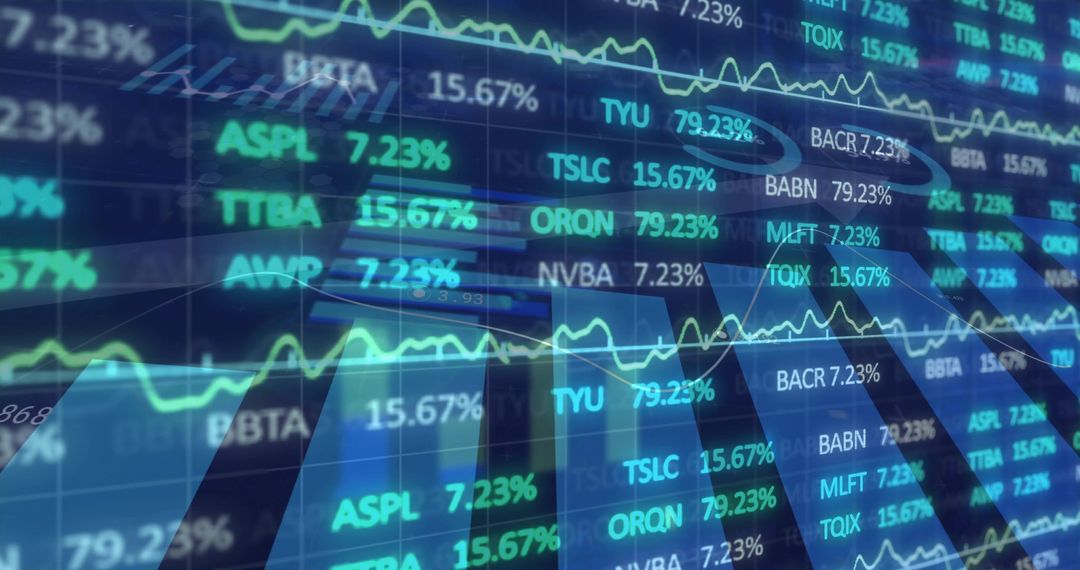
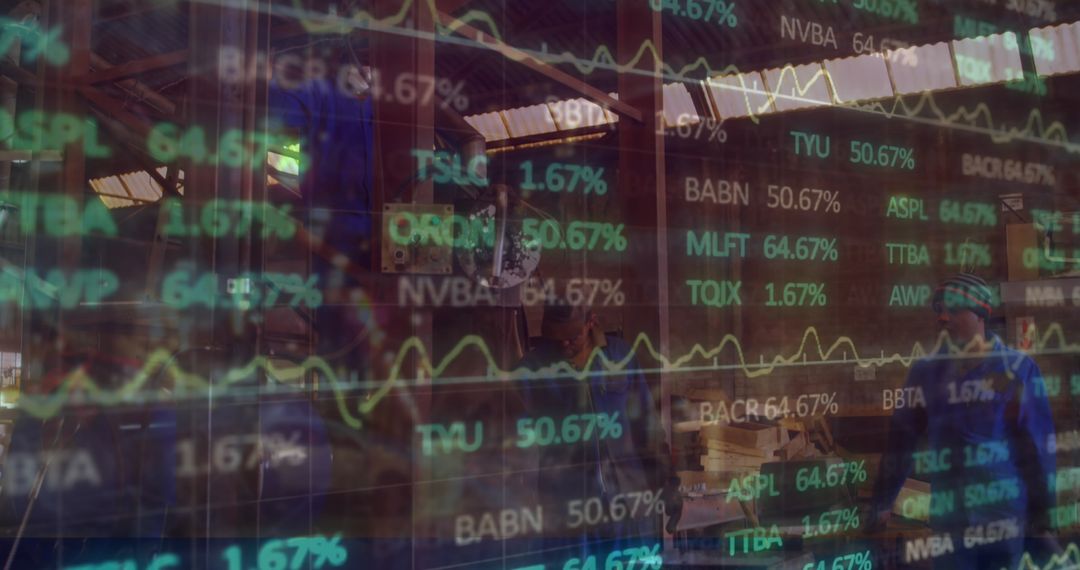
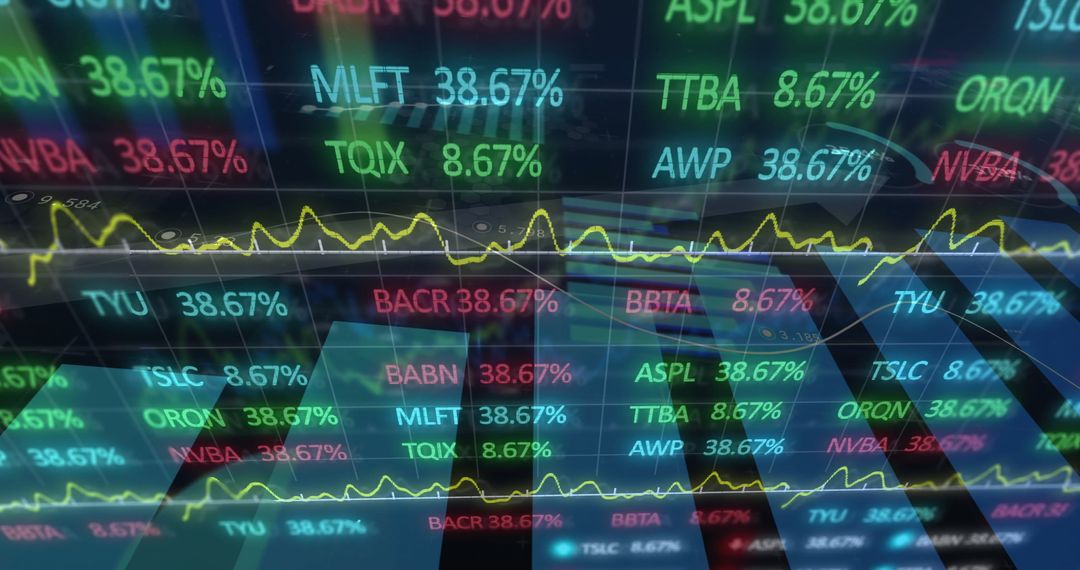
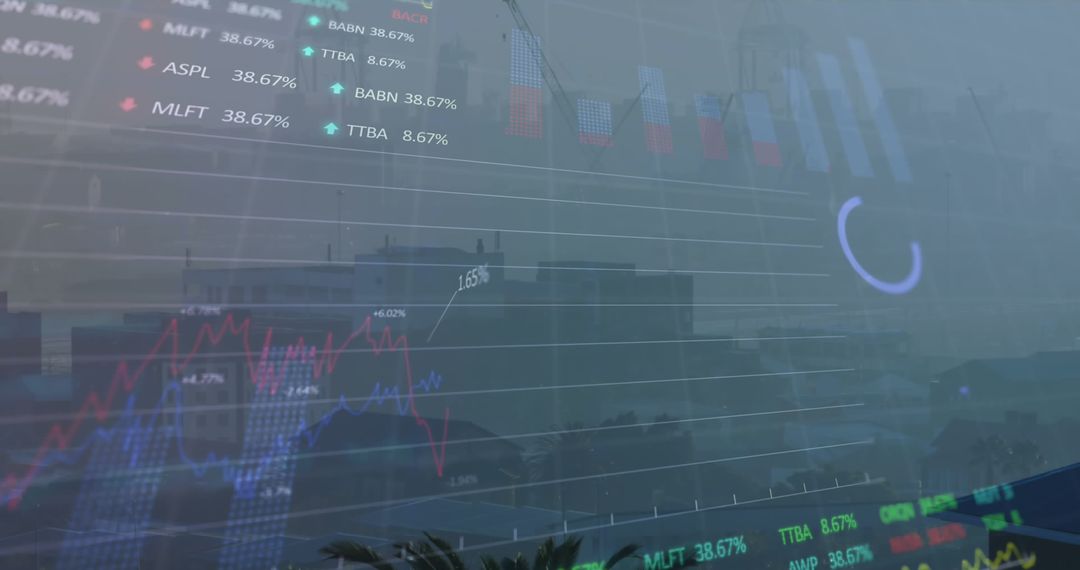
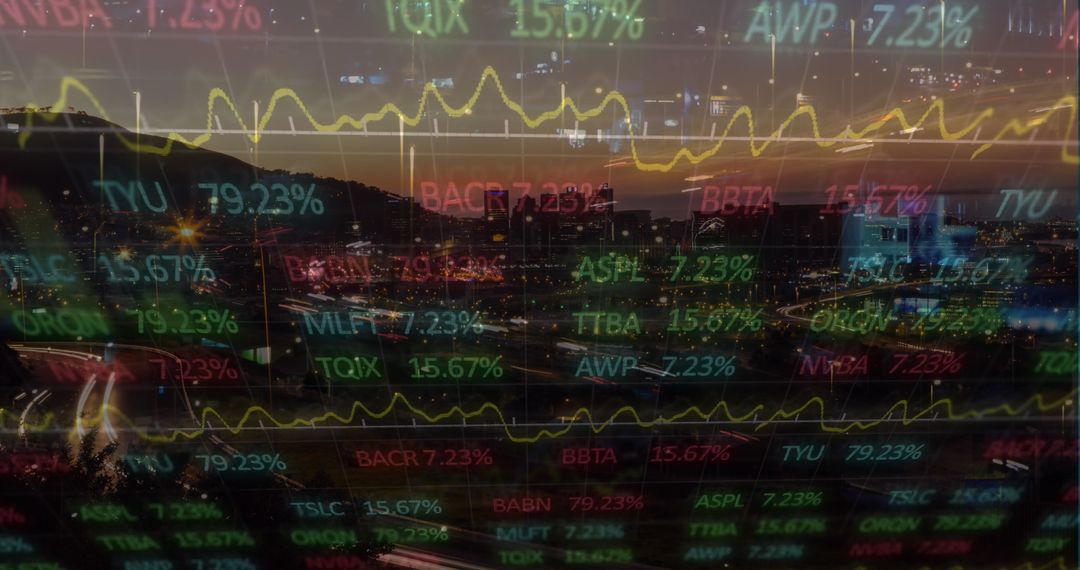
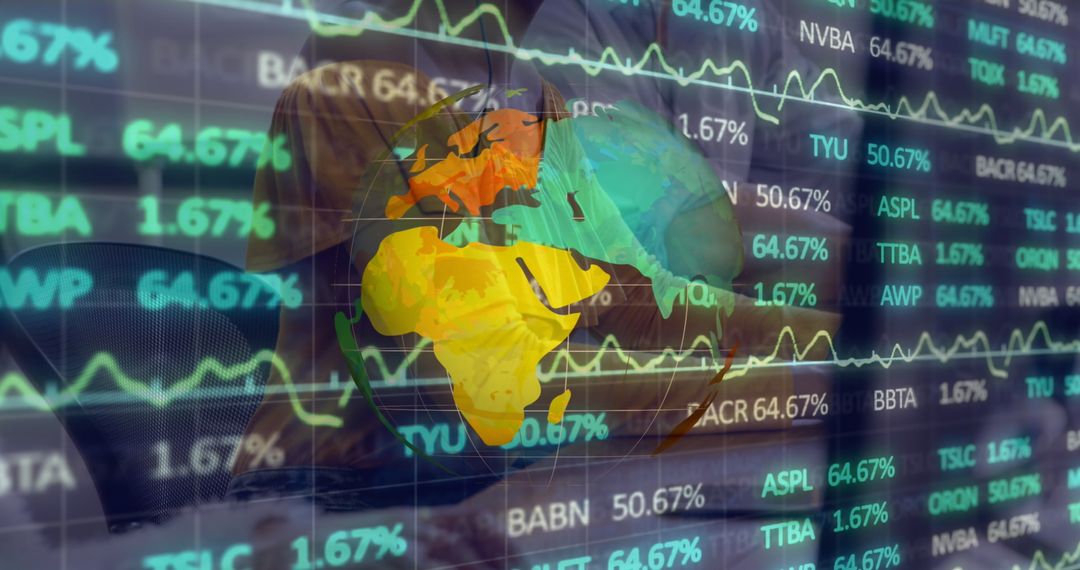
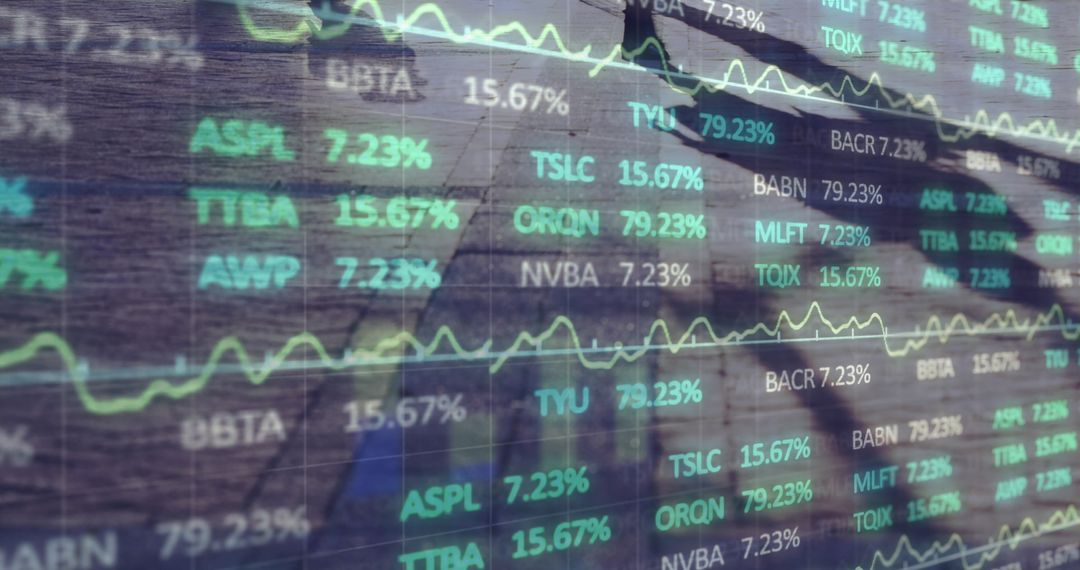
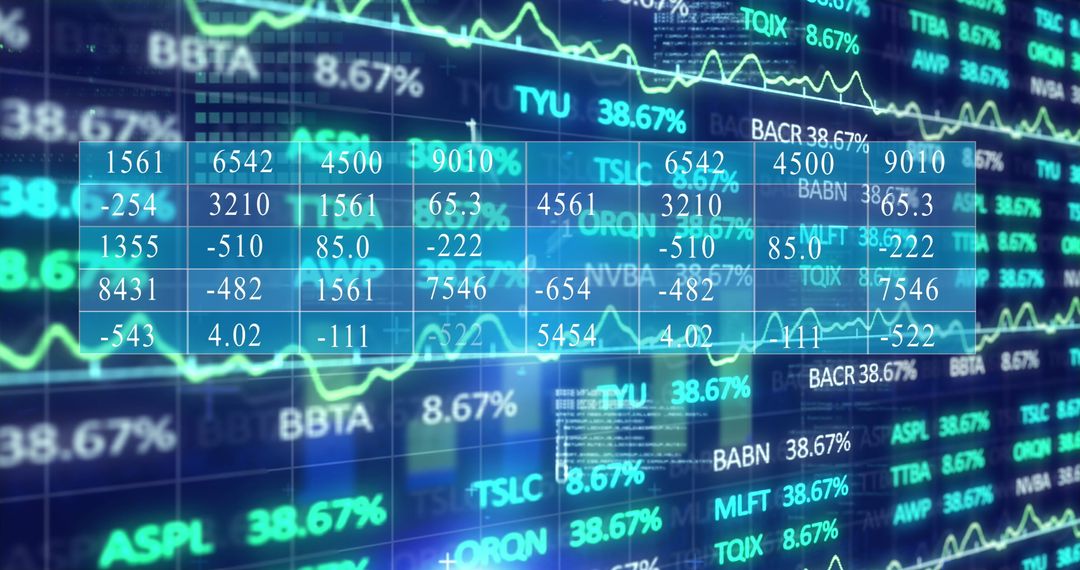
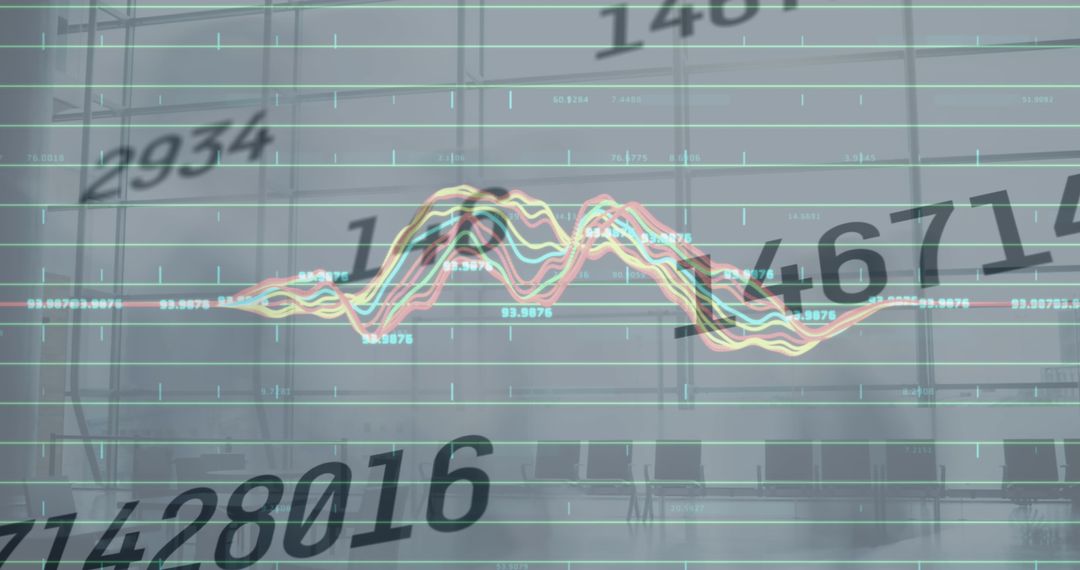
- Digital Financial Dashboard With Scrolling Stock Tickers
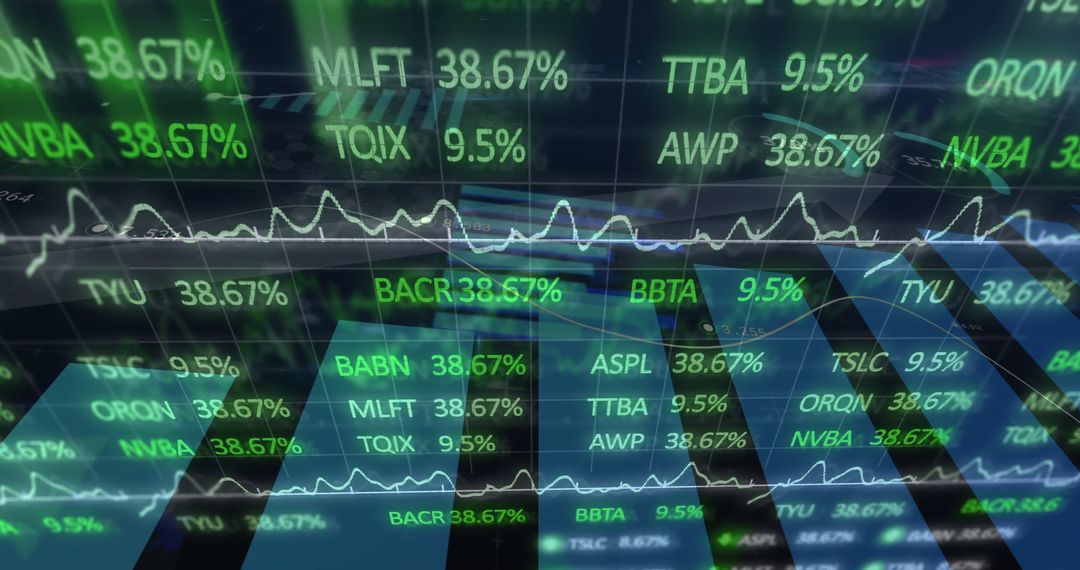
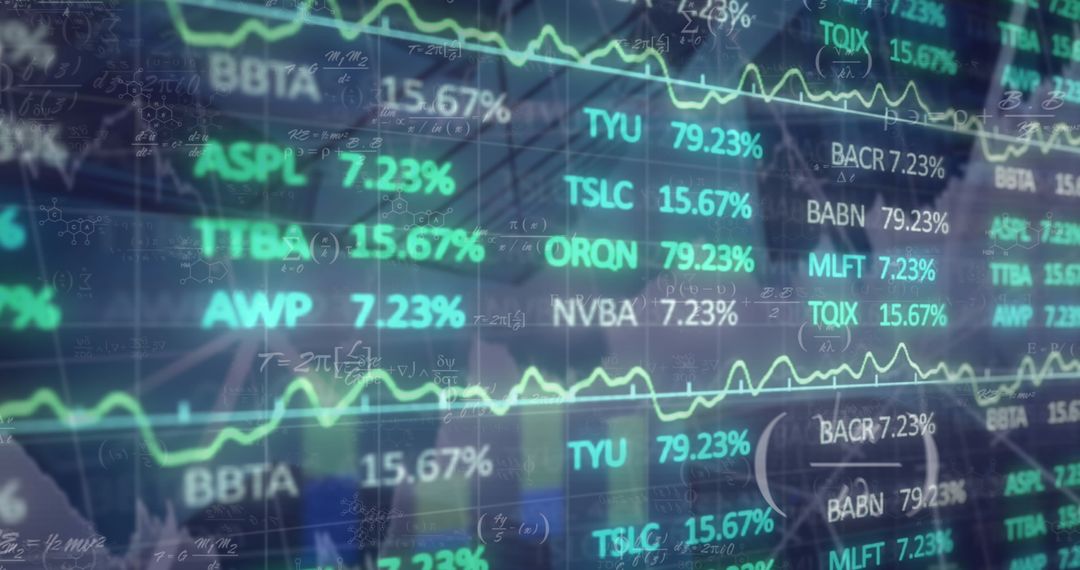
Digital Financial Dashboard With Scrolling Stock Tickers Image

Dynamic visual representation of a financial dashboard shows real-time stock market data, including scrolling tickers and line graphs displaying stock performances. This scene highlights advanced data analytics and investment technology, ideal for presentations, reports, and teaching materials relating to finance, economics, and market analysis. Useful for media related to stock trading and corporate financial systems.
Powered by  - Get 15% off with code: PIKWIZARD15


0
downloads
downloads
Tags:
More
Credit Photo
If you would like to credit the Photo, here are some ways you can do so
Text Link
photo Link
<span class="text-link">
<span>
<a target="_blank" href=https://pikwizard.com/photo/digital-financial-dashboard-with-scrolling-stock-tickers/873389ae8da23c4ed465b0b483059f40/>PikWizard</a>
</span>
</span>
<span class="image-link">
<span
style="margin: 0 0 20px 0; display: inline-block; vertical-align: middle; width: 100%;"
>
<a
target="_blank"
href="https://pikwizard.com/photo/digital-financial-dashboard-with-scrolling-stock-tickers/873389ae8da23c4ed465b0b483059f40/"
style="text-decoration: none; font-size: 10px; margin: 0;"
>
<img src="https://pikwizard.com/pw/medium/873389ae8da23c4ed465b0b483059f40.jpg" style="margin: 0; width: 100%;" alt="" />
<p style="font-size: 12px; margin: 0;">PikWizard</p>
</a>
</span>
</span>
Free (free of charge)
Free for personal and commercial use.
Author: People Creations
Similar Free Stock Images

Premium


Premium


Premium

Premium


Premium


Premium


Premium


Premium


Premium


Premium


Premium


Premium


Premium


Premium


Premium


Premium


Premium


Premium


Premium


Premium


Premium


Premium


Premium


Premium