- Home >
- Stock Photos >
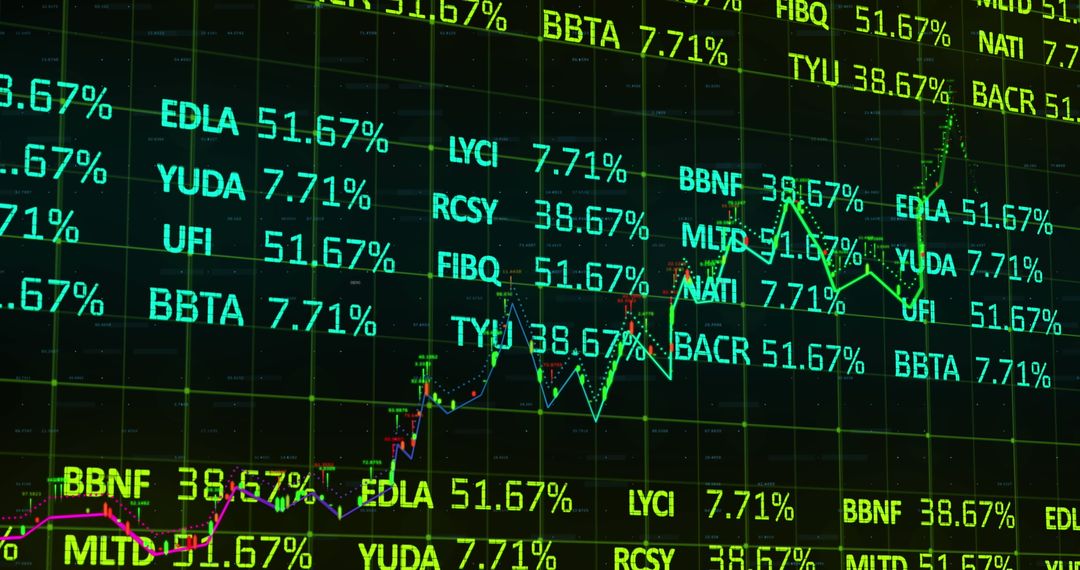
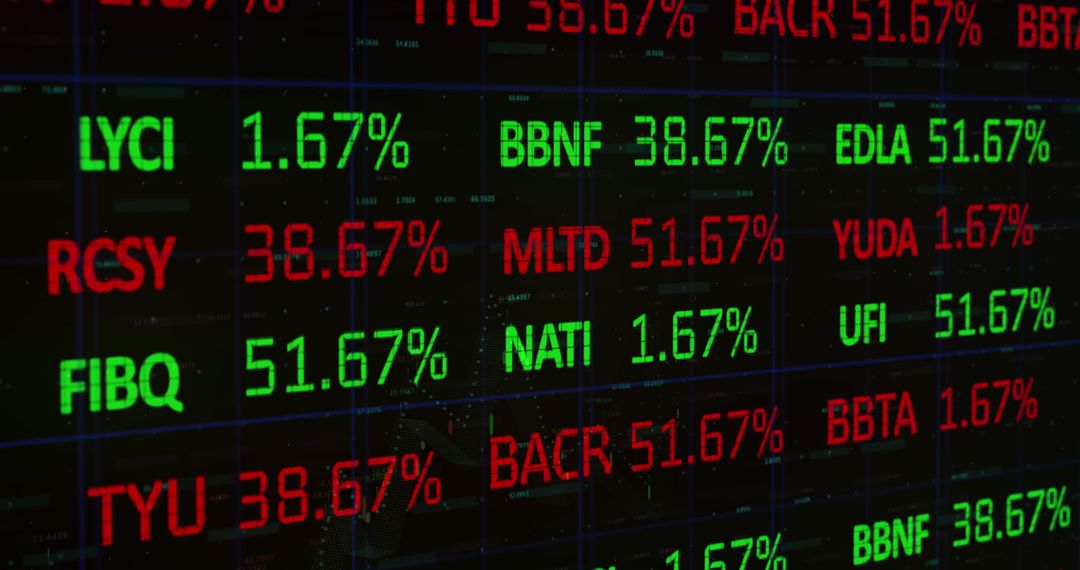
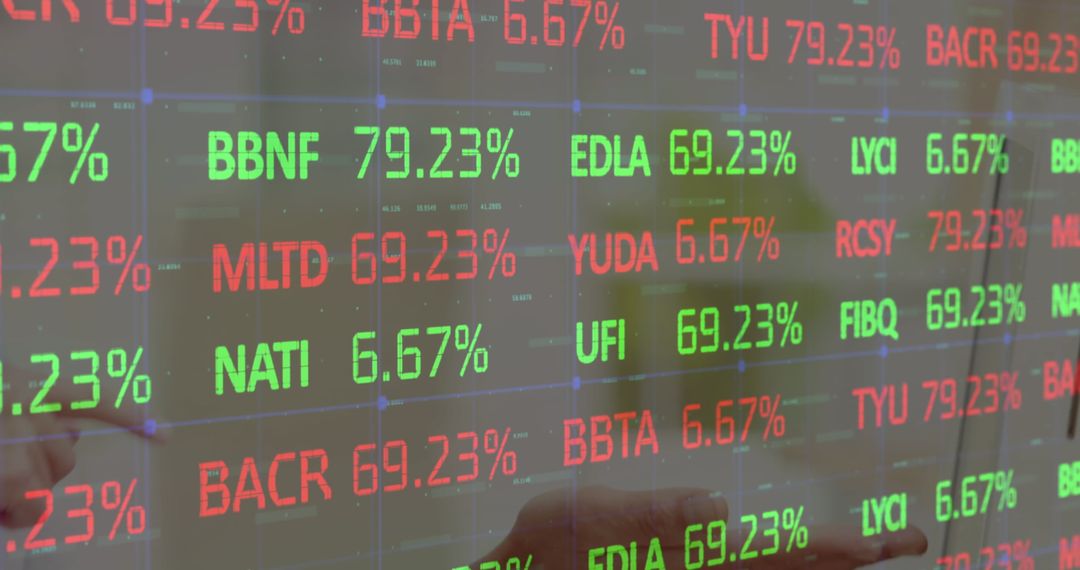
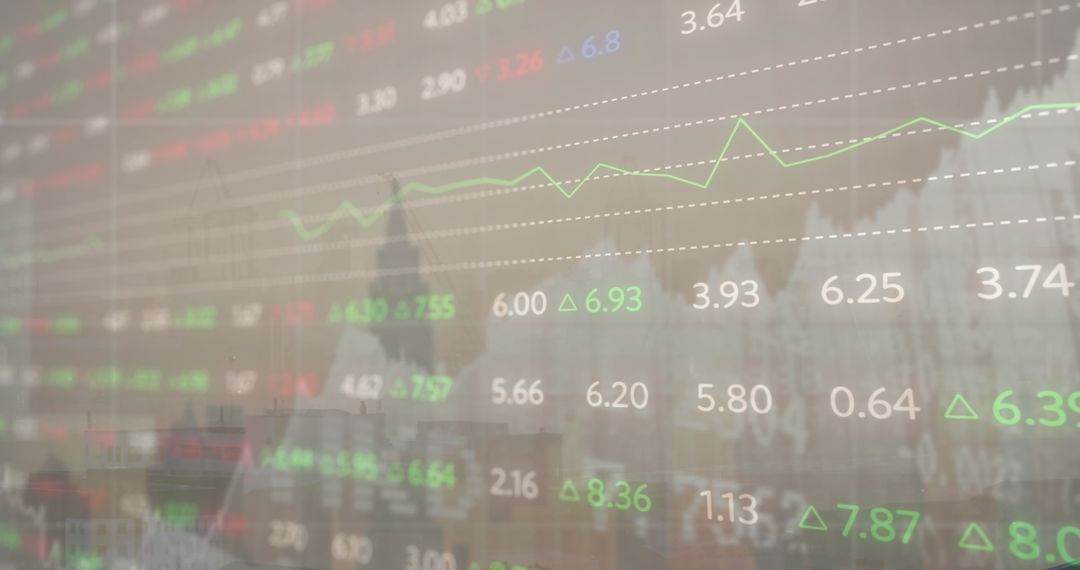
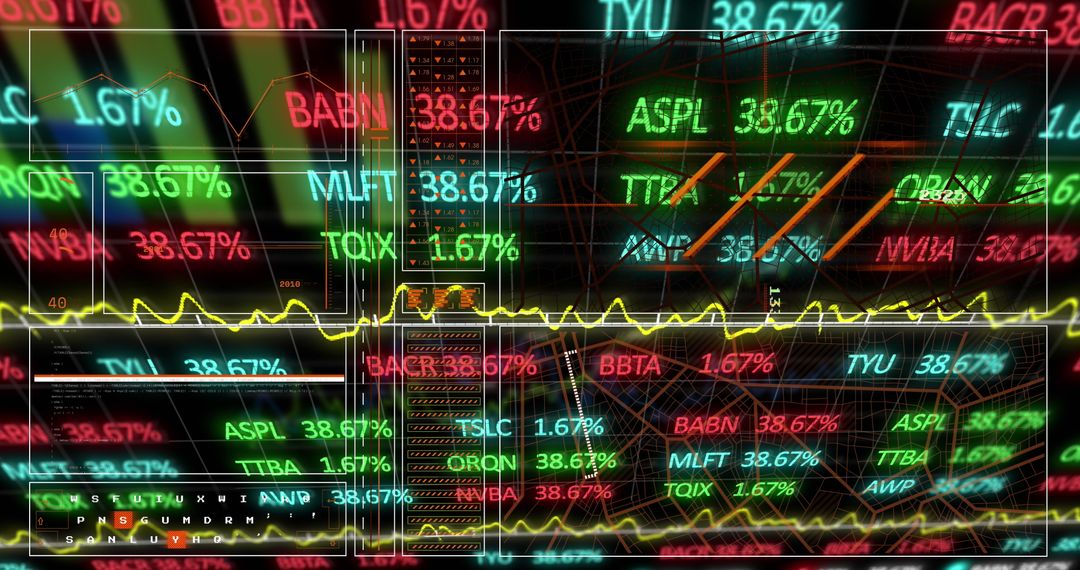
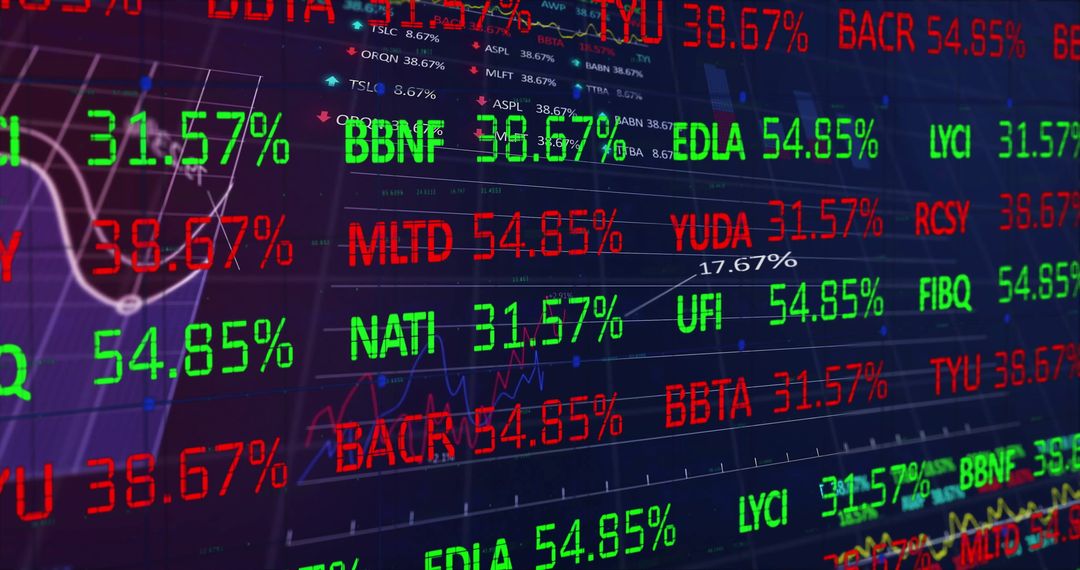
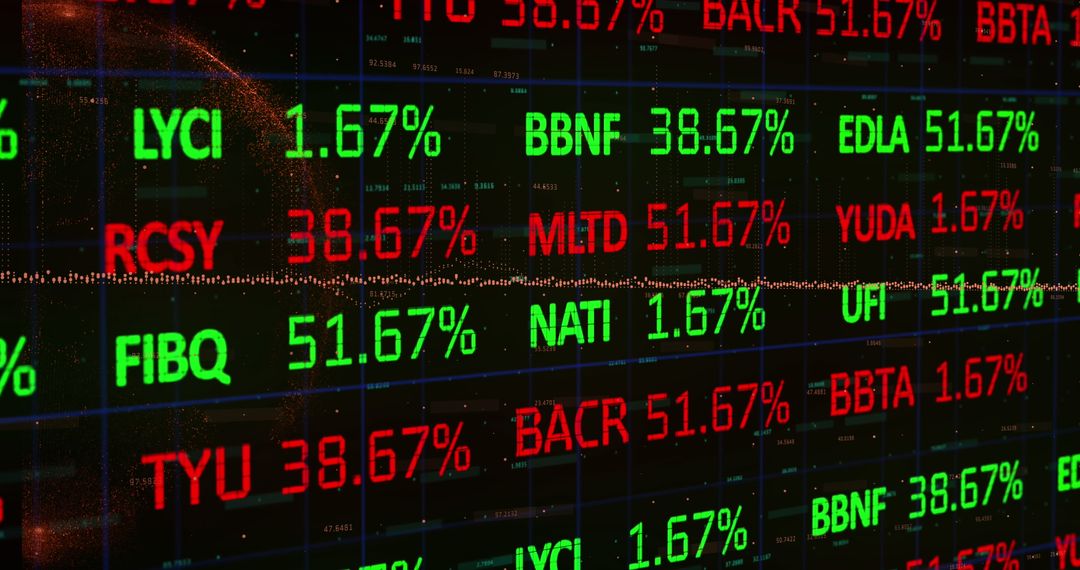
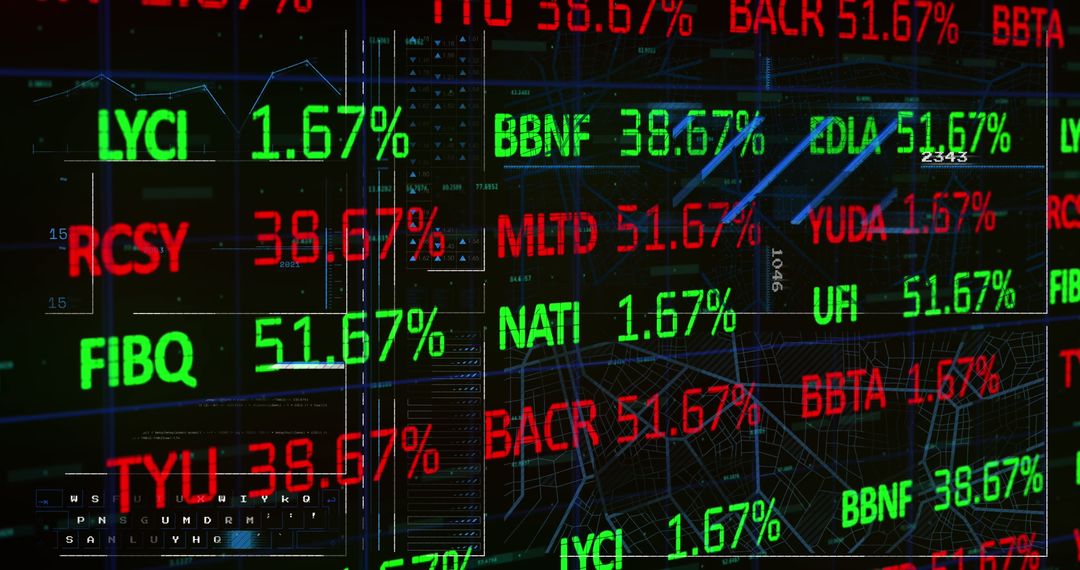
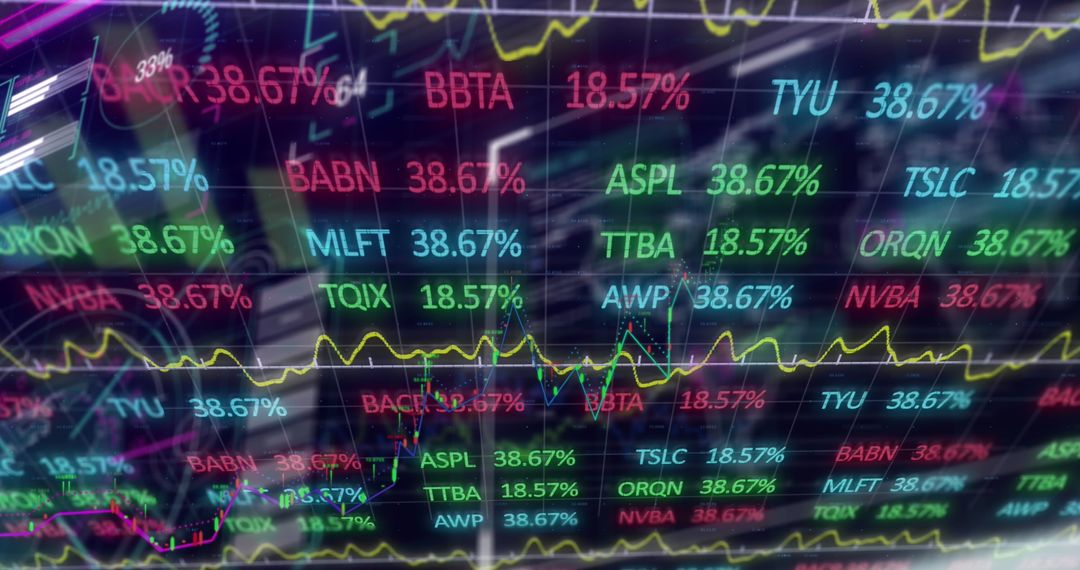
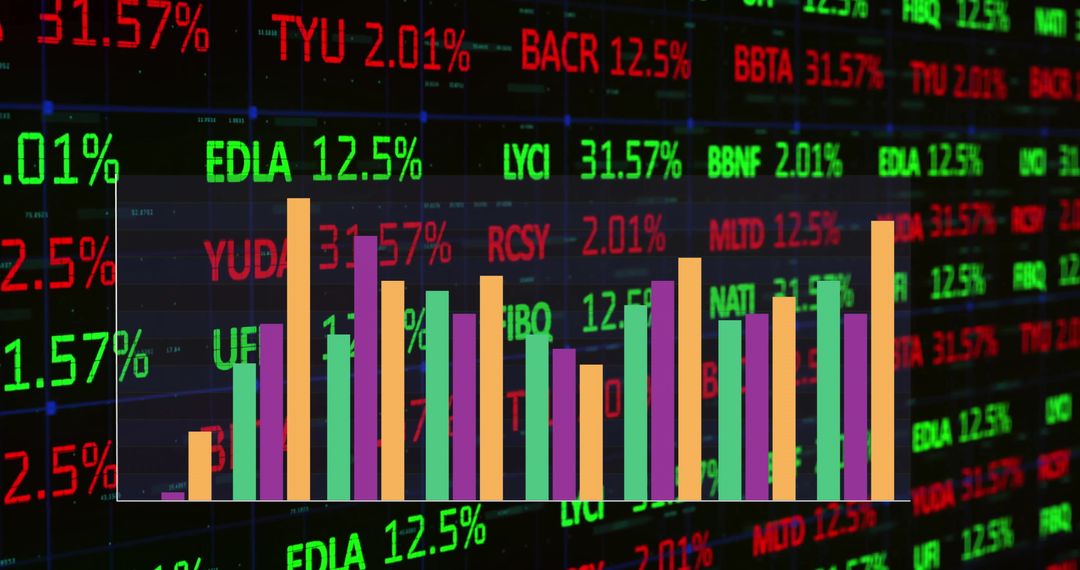
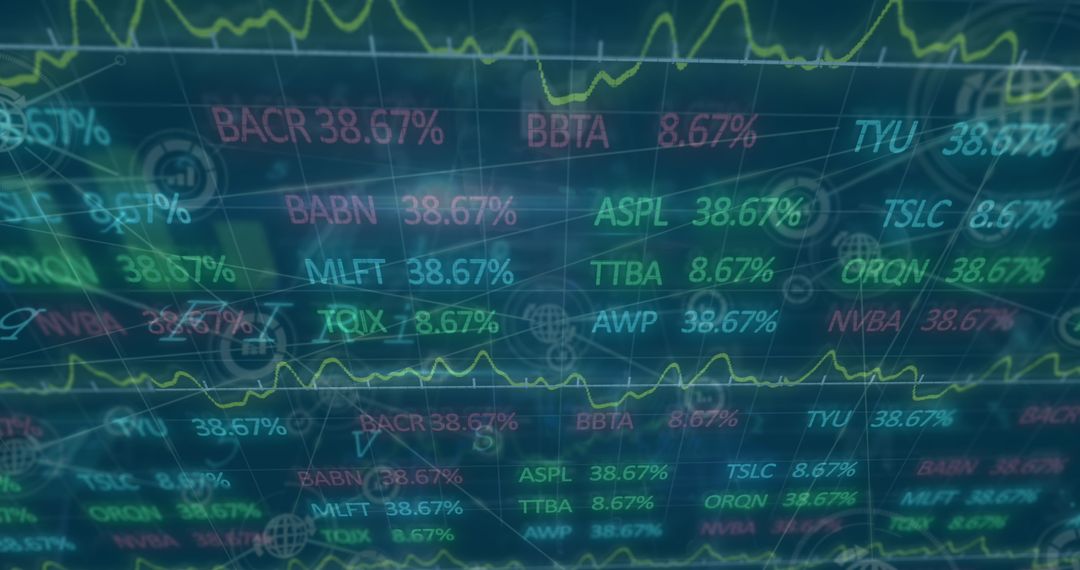
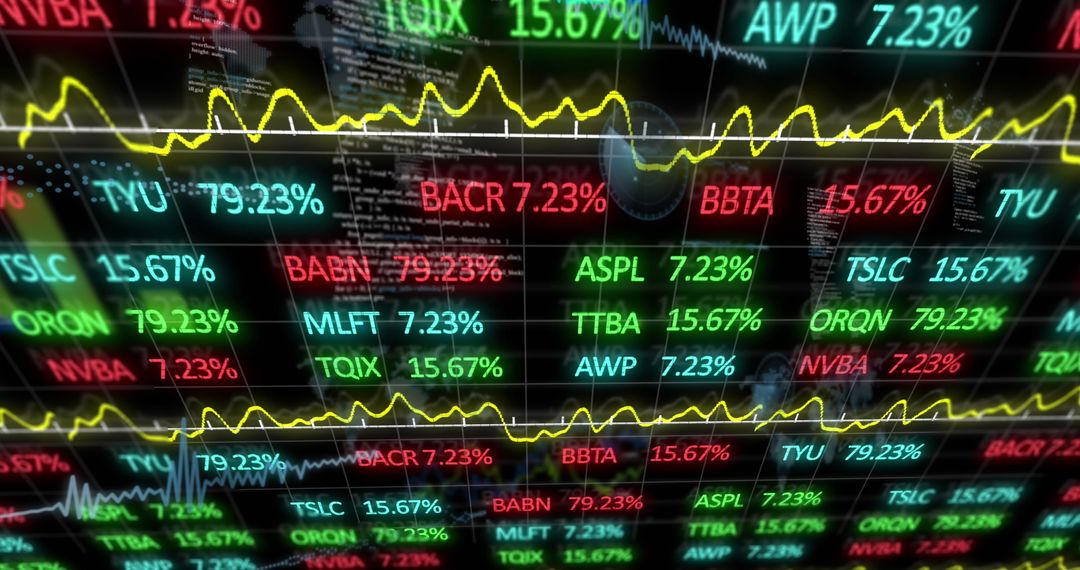
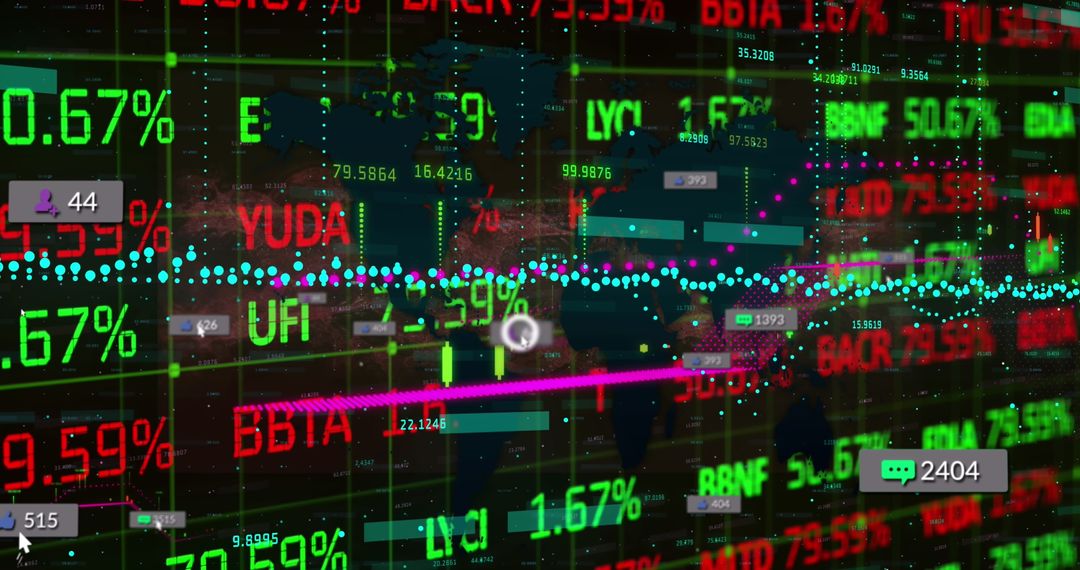
- Digital financial dashboard with stock data and analytical charts
Digital financial dashboard with stock data and analytical charts Image

Stock data and analytical charts depicting finance scene with evolving technology. Income growth, budget analysis presentations benefit from vivid diagrams and vibrant stock price fluctuation patterns.
Powered by  - Get 15% off with code: PIKWIZARD15


2
downloads
downloads
Tags:
More
Credit Photo
If you would like to credit the Photo, here are some ways you can do so
Text Link
photo Link
<span class="text-link">
<span>
<a target="_blank" href=https://pikwizard.com/photo/digital-financial-dashboard-with-stock-data-and-analytical-charts/ba6568c7a90467957e1aa587de2adf78/>PikWizard</a>
</span>
</span>
<span class="image-link">
<span
style="margin: 0 0 20px 0; display: inline-block; vertical-align: middle; width: 100%;"
>
<a
target="_blank"
href="https://pikwizard.com/photo/digital-financial-dashboard-with-stock-data-and-analytical-charts/ba6568c7a90467957e1aa587de2adf78/"
style="text-decoration: none; font-size: 10px; margin: 0;"
>
<img src="https://pikwizard.com/pw/medium/ba6568c7a90467957e1aa587de2adf78.jpg" style="margin: 0; width: 100%;" alt="" />
<p style="font-size: 12px; margin: 0;">PikWizard</p>
</a>
</span>
</span>
Free (free of charge)
Free for personal and commercial use.
Author: Authentic Images
Similar Free Stock Images

Premium


Premium


Premium


Premium


Premium


Premium


Premium


Premium


Premium


Premium


Premium


Premium


Premium


Premium


Premium


Premium


Premium


Premium


Premium


Premium


Premium


Premium


Premium


Premium